How Scanopy Saves You from Drawing Network Diagrams by Hand

Anyone who has ever tried to keep a current map of a company or home server network knows this pain. You sit down in draw.io or Visio, spend half a day neatly arranging little boxes for switches, servers, and connections. A week passes, the sysadmin swaps a couple of patch cables, the DevOps engineer spins up a new stack in Docker, and your hand-drawn diagram becomes a useless historical document.
Terraform or Ansible state doesn't always save you either. Infrastructure code only shows what's described in the pipeline, ignoring manual changes on switches or temporarily spun-up VMs.
I recently came across the Scanopy project. They built a tool that handles regular network scanning and automatically generates interactive diagrams at multiple abstraction levels.
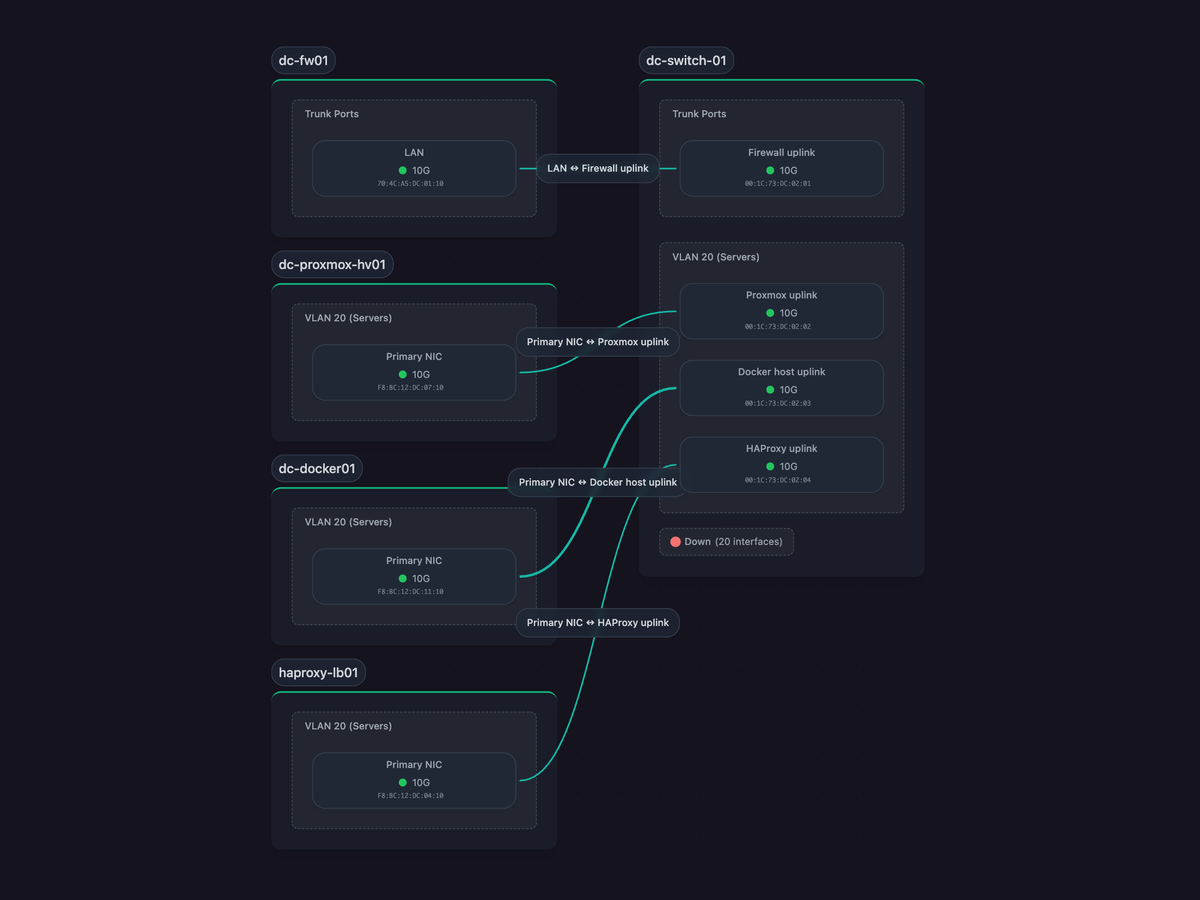
L2 (Physical) |
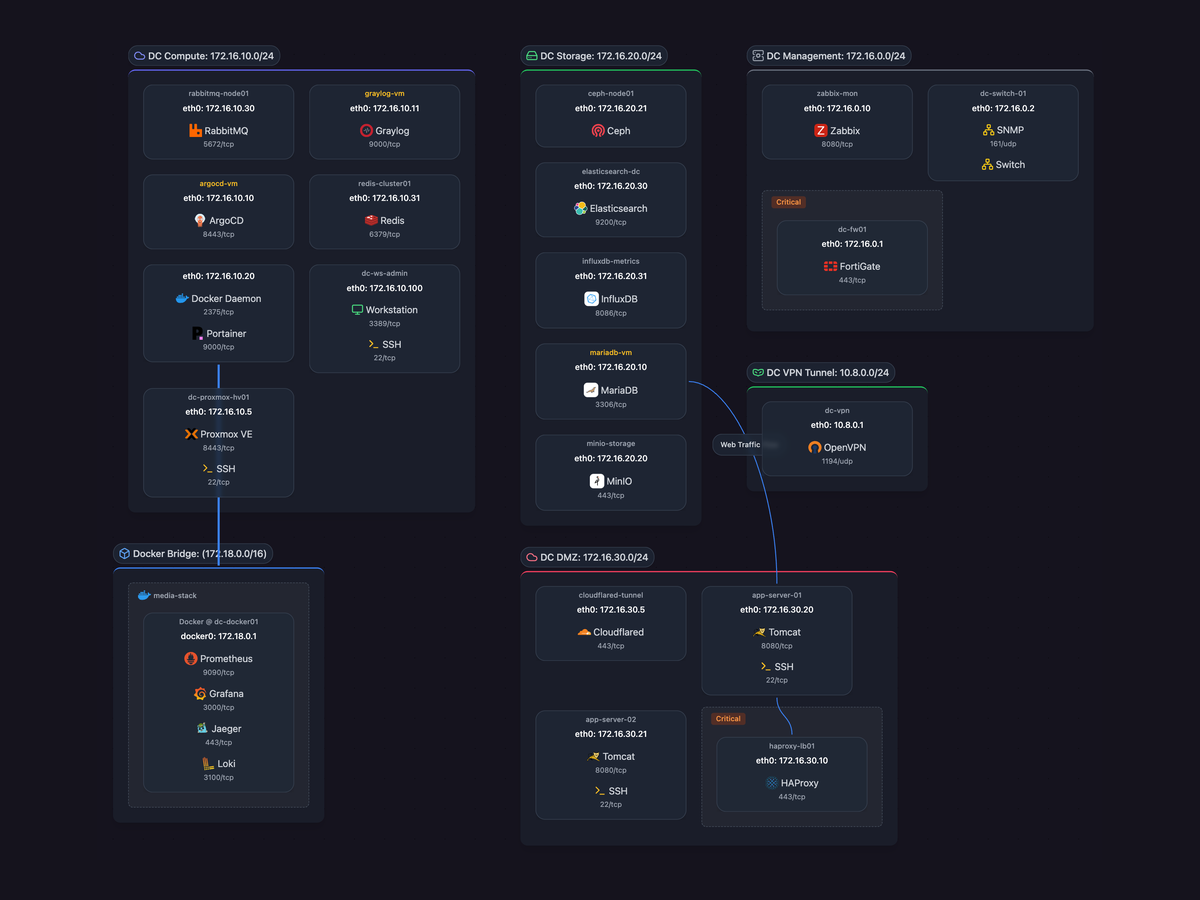
L3 (Logical) |
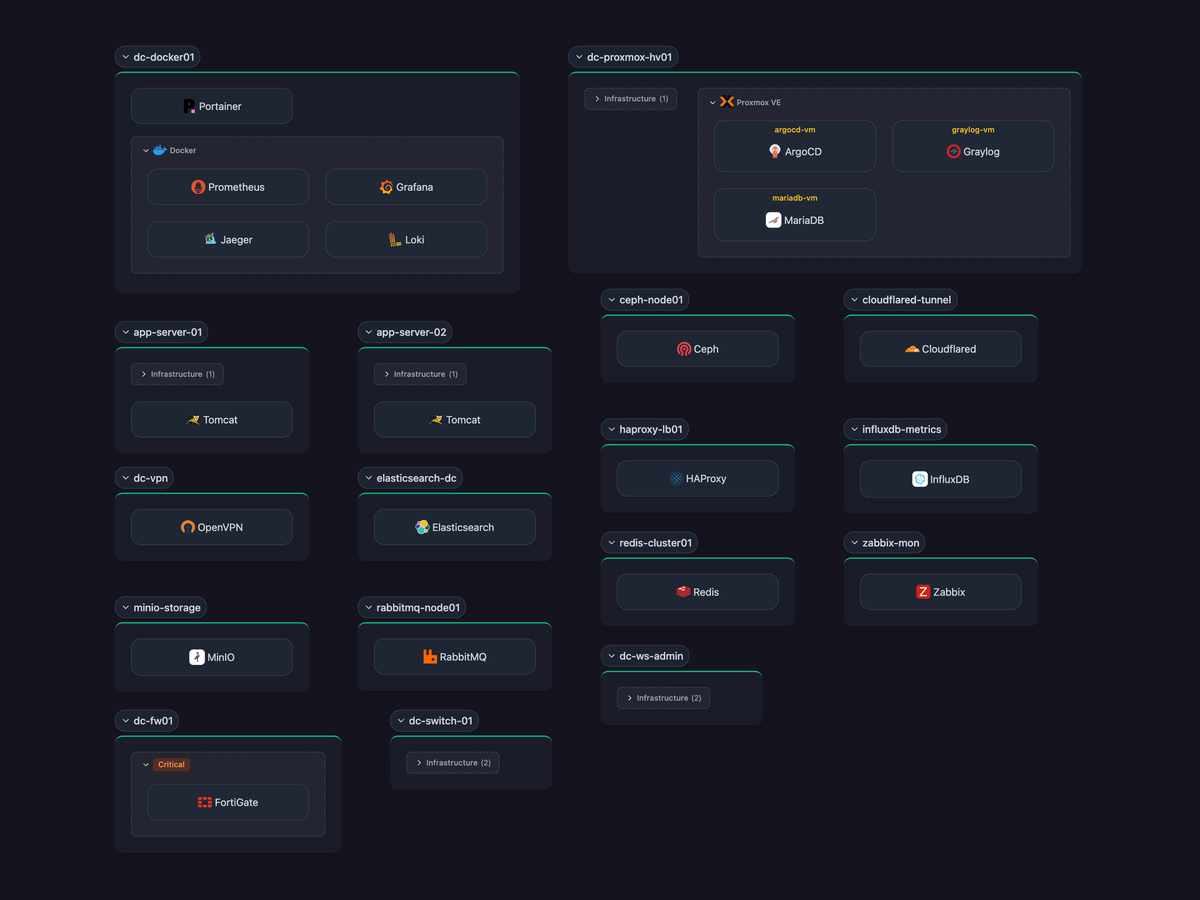
Workloads |
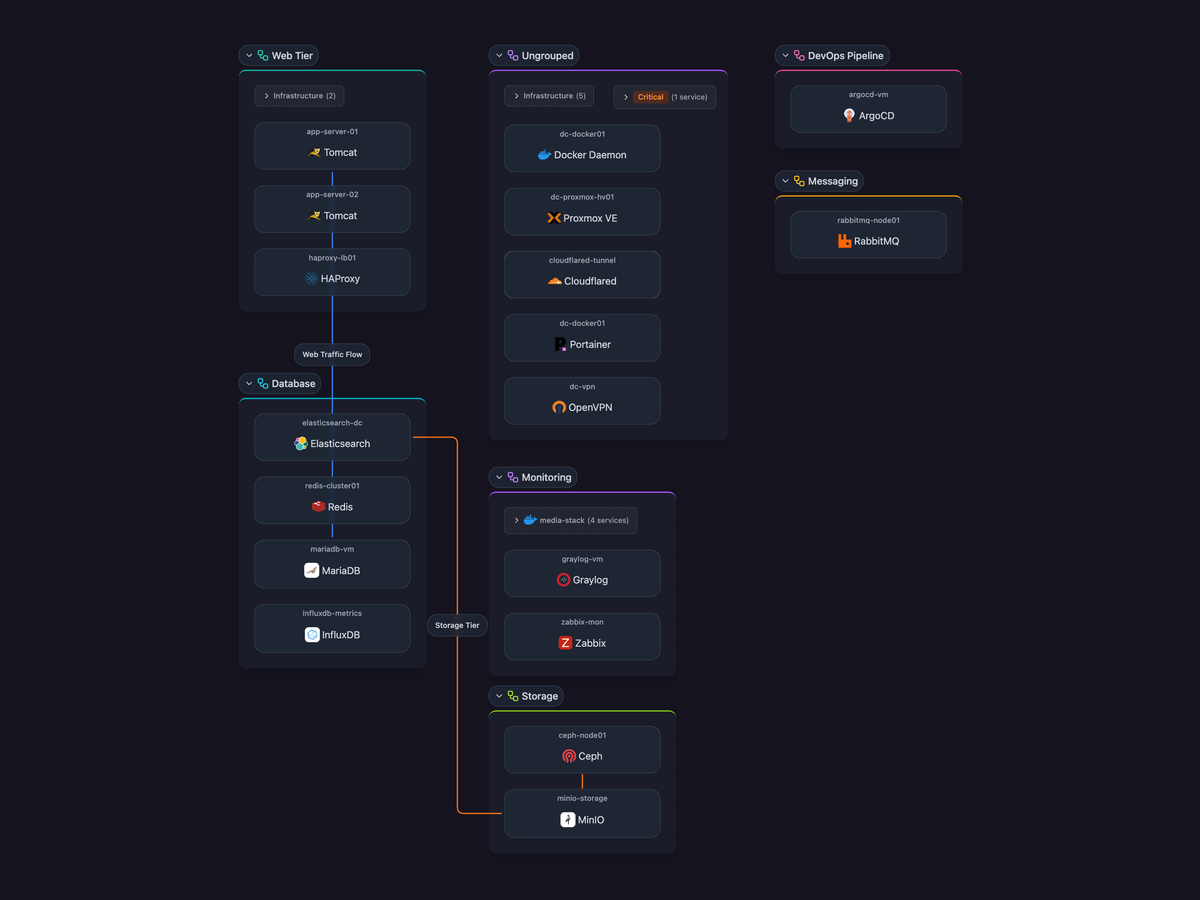
Applications |
How it works under the hood
Instead of installing heavy agents on every virtual machine, the project uses a lightweight daemon scanner. The daemon queries network devices via SNMP, parses LLDP and ARP tables, and scans open ports. When needed, the scanner connects directly to the Docker socket to inventory containers.
Under the hood, Scanopy is written in Rust. This gives fast scanner and server performance without bloating memory consumption.
After each scanner run, an infrastructure model is built, from which the system generates four separate slices:
- L2 physical layer. This includes switches, physical links, and specific equipment connection ports.
- L3 logical layer. Shows routing, subnets, and IP address distribution across hosts.
- Workloads. Shows the chain from bare metal servers and hypervisors to virtual machines and individual containers.
- Applications. Groups services and builds a dependency graph between databases, web servers, and background workers.
The project already ships with over two hundred pre-built service signatures. The scanner immediately recognizes PostgreSQL, Redis, Nginx, Kubernetes, and many other software without additional manual labeling.
What the scanner can do
The main advantage of this approach is autonomy. You set a schedule, and the scanner regularly updates the topology in the background.
Here are the practical features:
- Distributed data collection. For multiple offices or isolated VLANs, you can deploy separate daemons that send data to a central server.
- Diagram export. Finished diagrams can be exported as SVG, embedded in documentation as Mermaid code, or uploaded directly to Confluence.
- Interactive web interface. You can zoom in on the map, click on individual nodes, view active ports and neighboring connections.
- Role-based access model. There's built-in separation between organizations and users, which is useful for service companies and outsourcing teams.
Quick start in the lab
The easiest way to try the system is to spin up containers via Docker Compose on a host with access to the required subnet.
curl -O https://raw.githubusercontent.com/scanopy/scanopy/refs/heads/main/docker-compose.yml
docker compose up -d
After startup, the web interface listens on port 60072. Navigate to http://localhost:60072, create a local administrator account, and start the first scan cycle.
If you run a homelab on Proxmox VE, the authors have a ready-made script for deployment in an LXC container. Scanopy is also available in the Unraid app catalog.
If you don't want to install locally, the creators have a public demo sandbox at demo.scanopy.net with pre-populated test data.
Who the project will save time for
For operations engineers and DevOps teams, Scanopy addresses the eternal question of "where does this traffic go and where is this container running." You see physical and logical hardware bindings without having to manually collect traces.
For network engineers, the utility helps keep an up-to-date switching map without tedious hours in graphical editors. When migrating a service or switching ports, the topology updates itself with the next scan.
For home server and homelab owners, the tool provides a way to organize your services sprawl without spending your weekends on manual documentation.
Summary
Scanopy solves the classic problem of documentation becoming outdated in a direct and straightforward way. Diagrams are generated based on the actual state of the network, not the developer's understanding from six months ago.
The code is distributed under the AGPL-3.0 license for self-hosting. If you've been putting off updating your infrastructure maps or are tired of redrawing diagrams after every release, deploy the daemon to a test network and see the results of the first run.
Ähnliche Projekte