Ultra Profiler Combines Low-Level .NET Trace Collection with Firefox Profiler Interface
Every time performance drops or memory usage spikes in a .NET application, the familiar quest begins. PerfView scares you with its early-2000s interface, dotnet-trace spits out dry reports, and full-featured commercial profilers often turn out to be heavy beasts. Recently, Alexander Mütel (known as xoofx, author of Markdig and numerous other low-level C# utilities) released his tool Ultra, which tries to combine detailed trace collection with a convenient web interface.
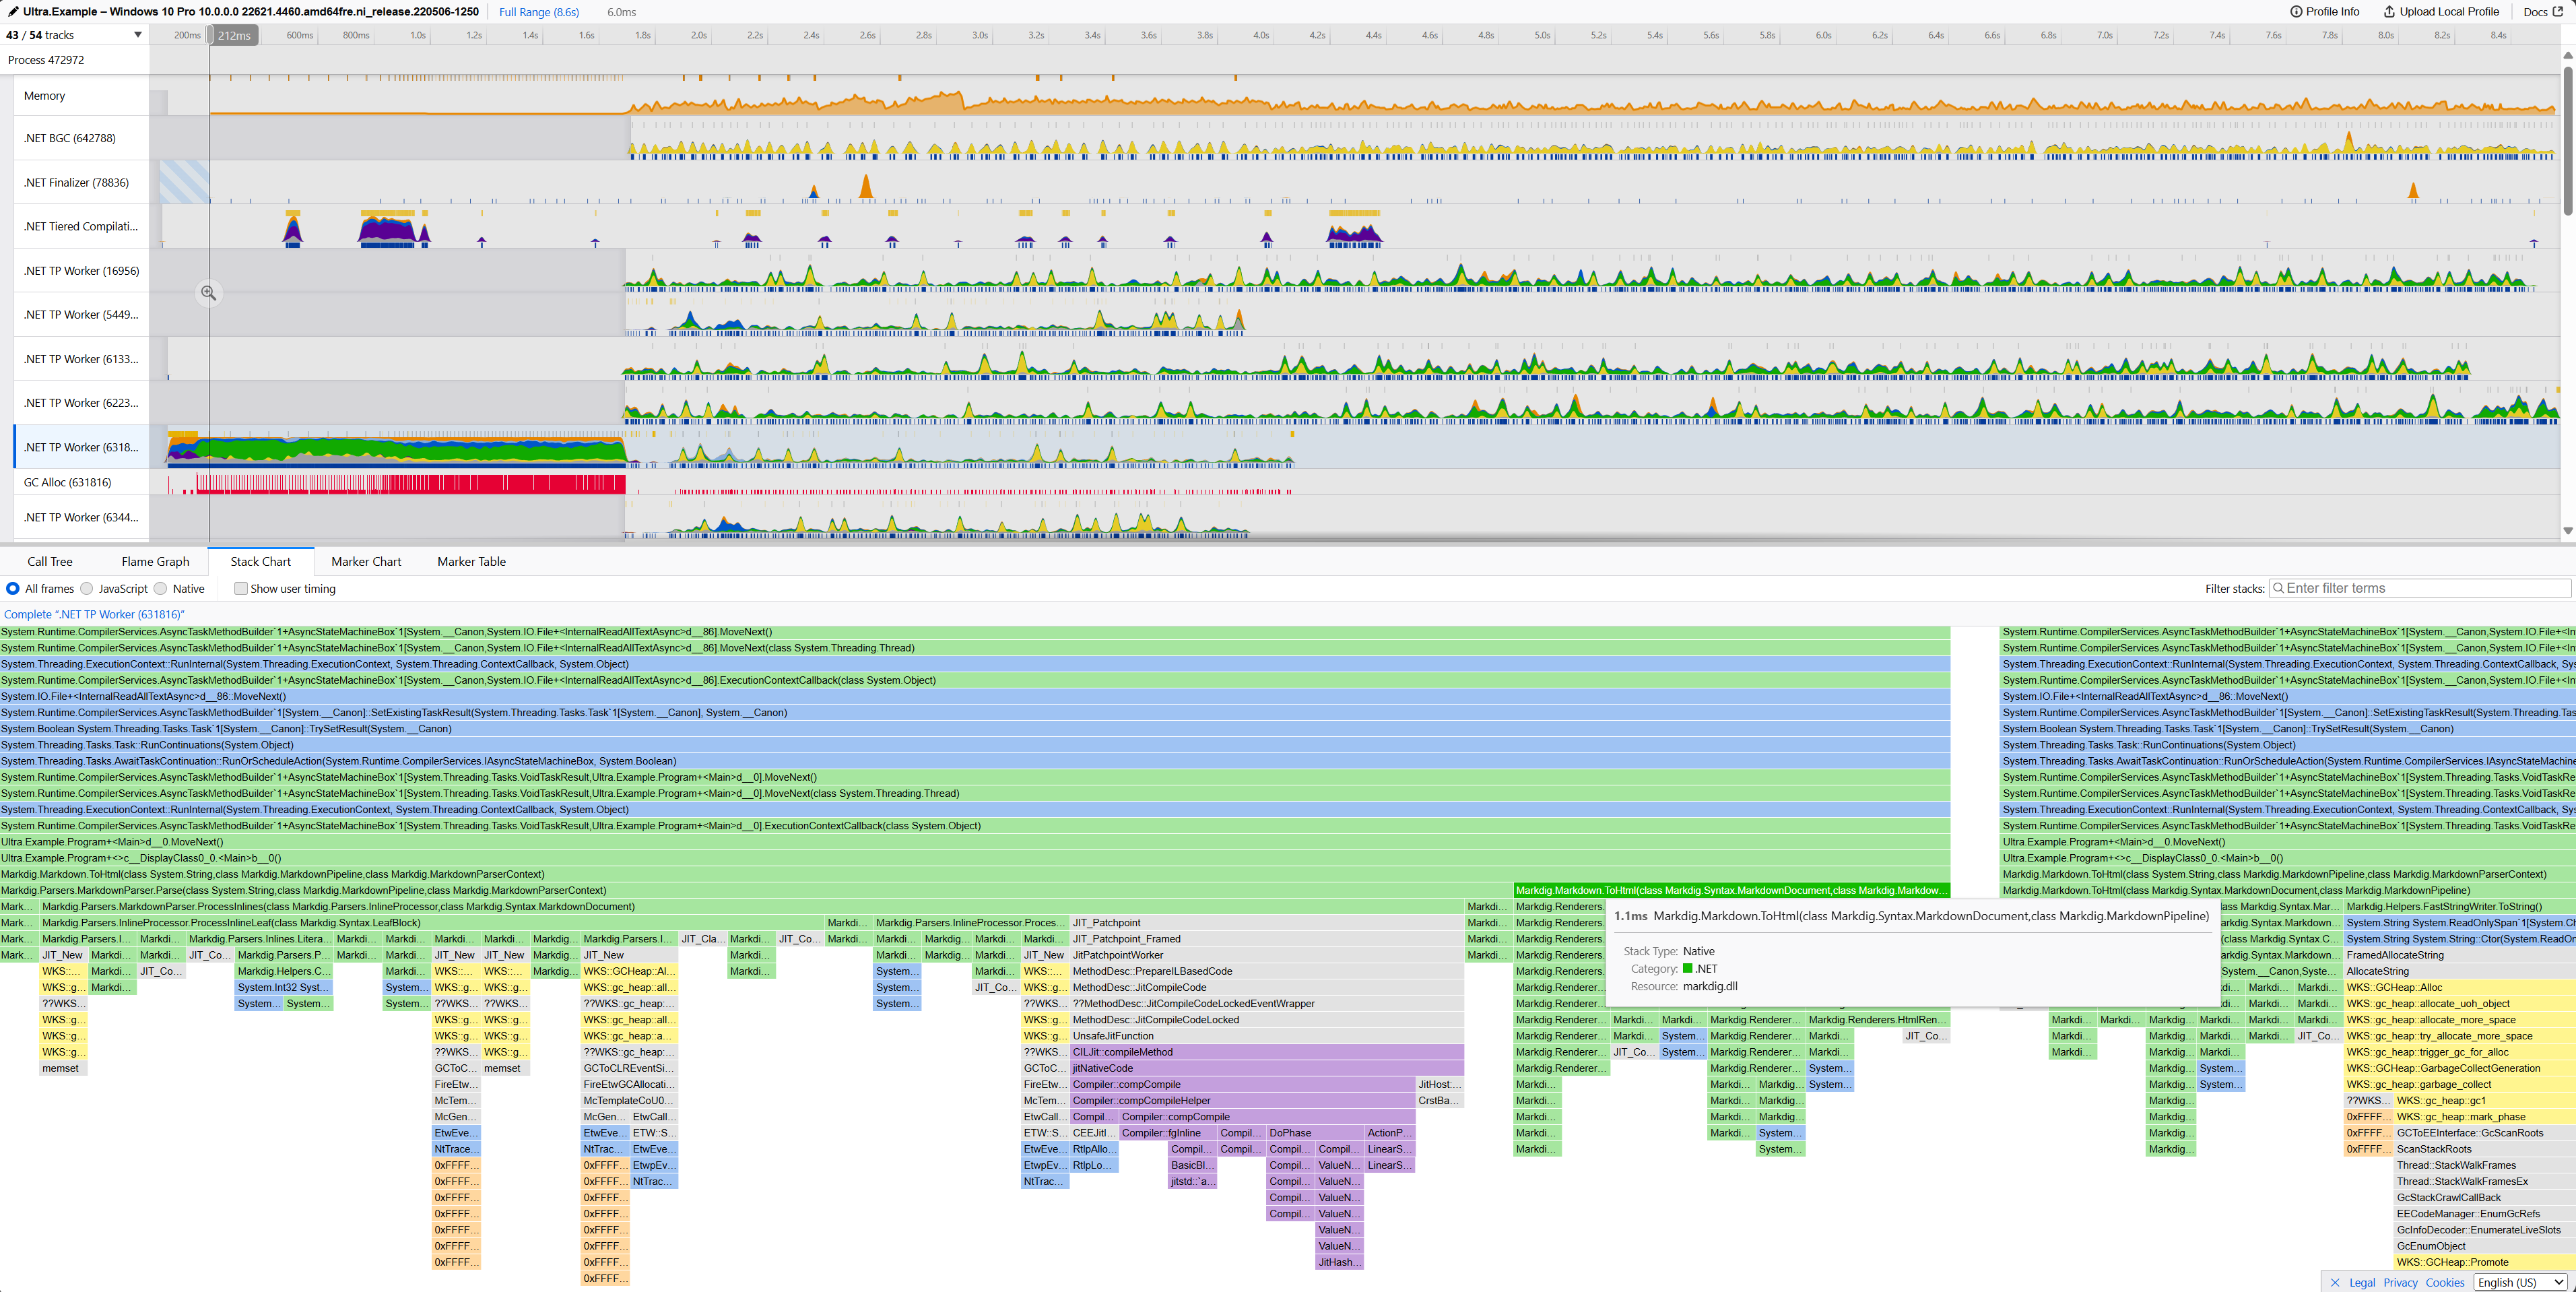
The tool collects low-level samples down to the OS kernel and displays results through profiler.firefox.com. The result is a lightweight command-line tool that generates traces just a couple of megabytes in size and immediately opens a clear visualization with timelines, flamegraphs, and call trees.
What's Under the Hood and How It Works
The main idea behind the project is to avoid inventing its own bulky UI. The author took the Firefox Profiler engine, which excels at interactive graphs, and wrote an efficient data collector for .NET.
Collection is handled differently on different platforms:
- On Windows, profiling relies on ETW (Event Tracing for Windows). Sampling frequency here can reach up to 8190 samples per second. This gives you a honest call stack: you can see not only managed .NET code, but also CLR runtime calls, native library calls, and Windows kernel functions.
- On macOS, the collector works through dynamic library injection directly into the process at startup and listens to EventPipe. Here the frequency is limited to 1000 samples per second, and the trace captures managed and native user-space calls.
In the report, all calls are neatly highlighted and organized by category: .NET, .NET JIT, .NET GC, .NET CLR, Native, and Kernel. It's immediately clear whether the process is spinning in your loop, waiting on a thread lock in the kernel, or stuck on method compilation.
Details on the Garbage Collector and JIT
In addition to CPU samples, the utility attaches runtime events.
JIT compilation markers with specific method names appear in the timeline, so the application warmup phase is clearly visible. For GC, the trace records heap statistics, runtime pause events (GCSuspendEE and GCRestartEE), and memory allocations.
The traces are compact: a ten-second run usually weighs just a few megabytes. The resulting file can be shared with a colleague or uploaded directly to share.firefox.dev for collaborative incident analysis.
Quick Start
The utility is distributed as a standard global tool. It requires .NET SDK 10 or higher:
dotnet tool install -g Ultra
On Windows, administrative rights are needed to collect kernel stacks. You can profile a separate program using the argument separator --:
ultra.exe profile -- my_command.exe arg0 arg1
If a service is already running on a server or local machine, just pass the process ID:
ultra.exe profile 15243
After collection finishes with Ctrl+C, the utility saves the trace file.
On macOS with Apple Silicon chips, elevated privileges aren't required, but there's a caveat. The profiler only works on launching a new binary:
ultra profile -- ./my_command arg0 arg1
Attaching by PID on Mac isn't possible yet, because the collector injects exclusively at process startup. Kernel stack collection on macOS isn't supported either, and symbols from system libraries in the dyld shared cache remain unresolved.
Integration with Language Models
An interesting detail: the project ecosystem already has a separate MCP server called UltraMCP by Kirill Osenkov. It connects profiling results directly to AI agents like Cursor or Claude Desktop. An agent can read the trace itself, find bottlenecks in the code, and suggest optimization fixes without manually copying stack traces into a chat.
Is It Worth Trying
The tool is fresh, with an open BSD-2-Clause license. On macOS there are still functional limitations, but for Windows it's already a great replacement for heavy utilities.
If you regularly need to figure out why a service is slow to start, where memory goes in a tight loop, or how much time JIT takes, add Ultra to your toolkit. Quick trace collection with a single command without fiddling with configuration saves a ton of time.
Projets similaires