Beautiful Diagrams Without Figma and Heavy Editors
Every time you need to draw application architecture or an API call sequence, you run into the same problem. You can go to Figma and spend half an hour tweaking rounded corners, fonts, and the right shades of gray. Or you can ask Claude or ChatGPT to generate Mermaid code, but you'll end up with a standard diagram with garish colors and weird layout.
The author of the diagram-design repository, Katherine Lavery, ran into this routine while maintaining her own blog. Instead of moving pixels around manually every time, she created a set of instructions for Claude Code, Pi, and Codex. The project turns an LLM into a tidy typesetter that generates standalone HTML and SVG without third-party libraries, JavaScript, or heavy builds.
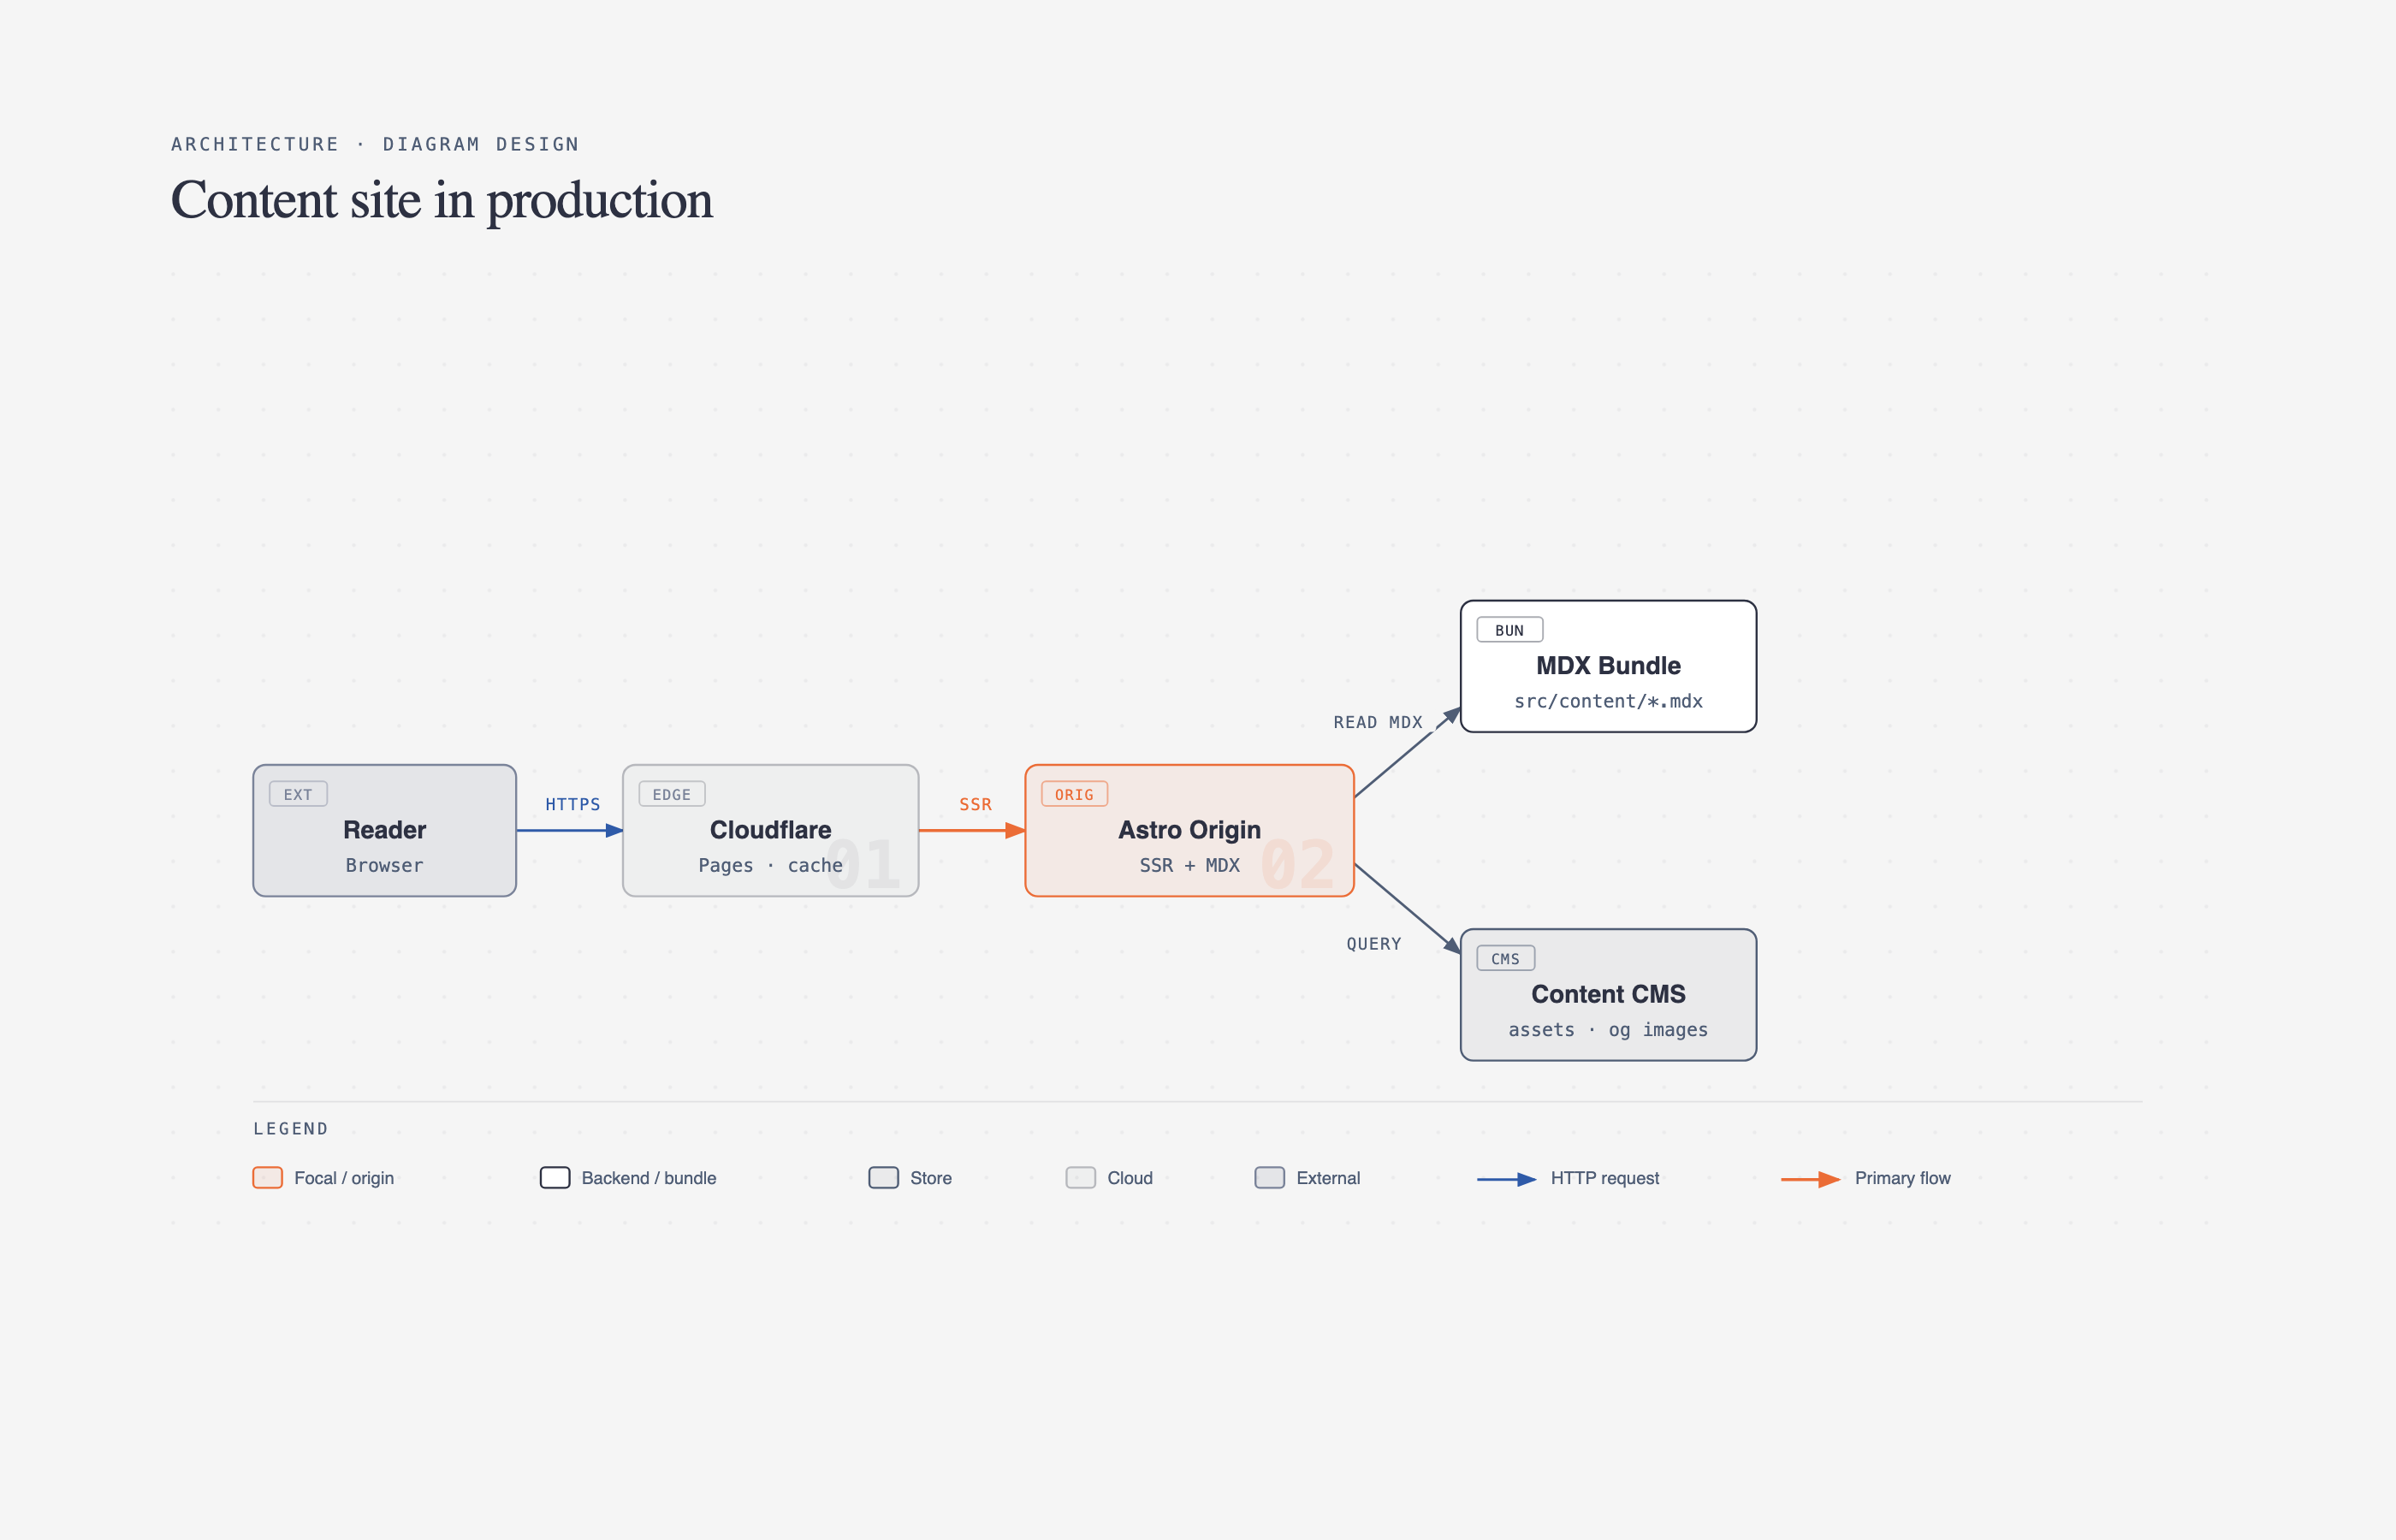
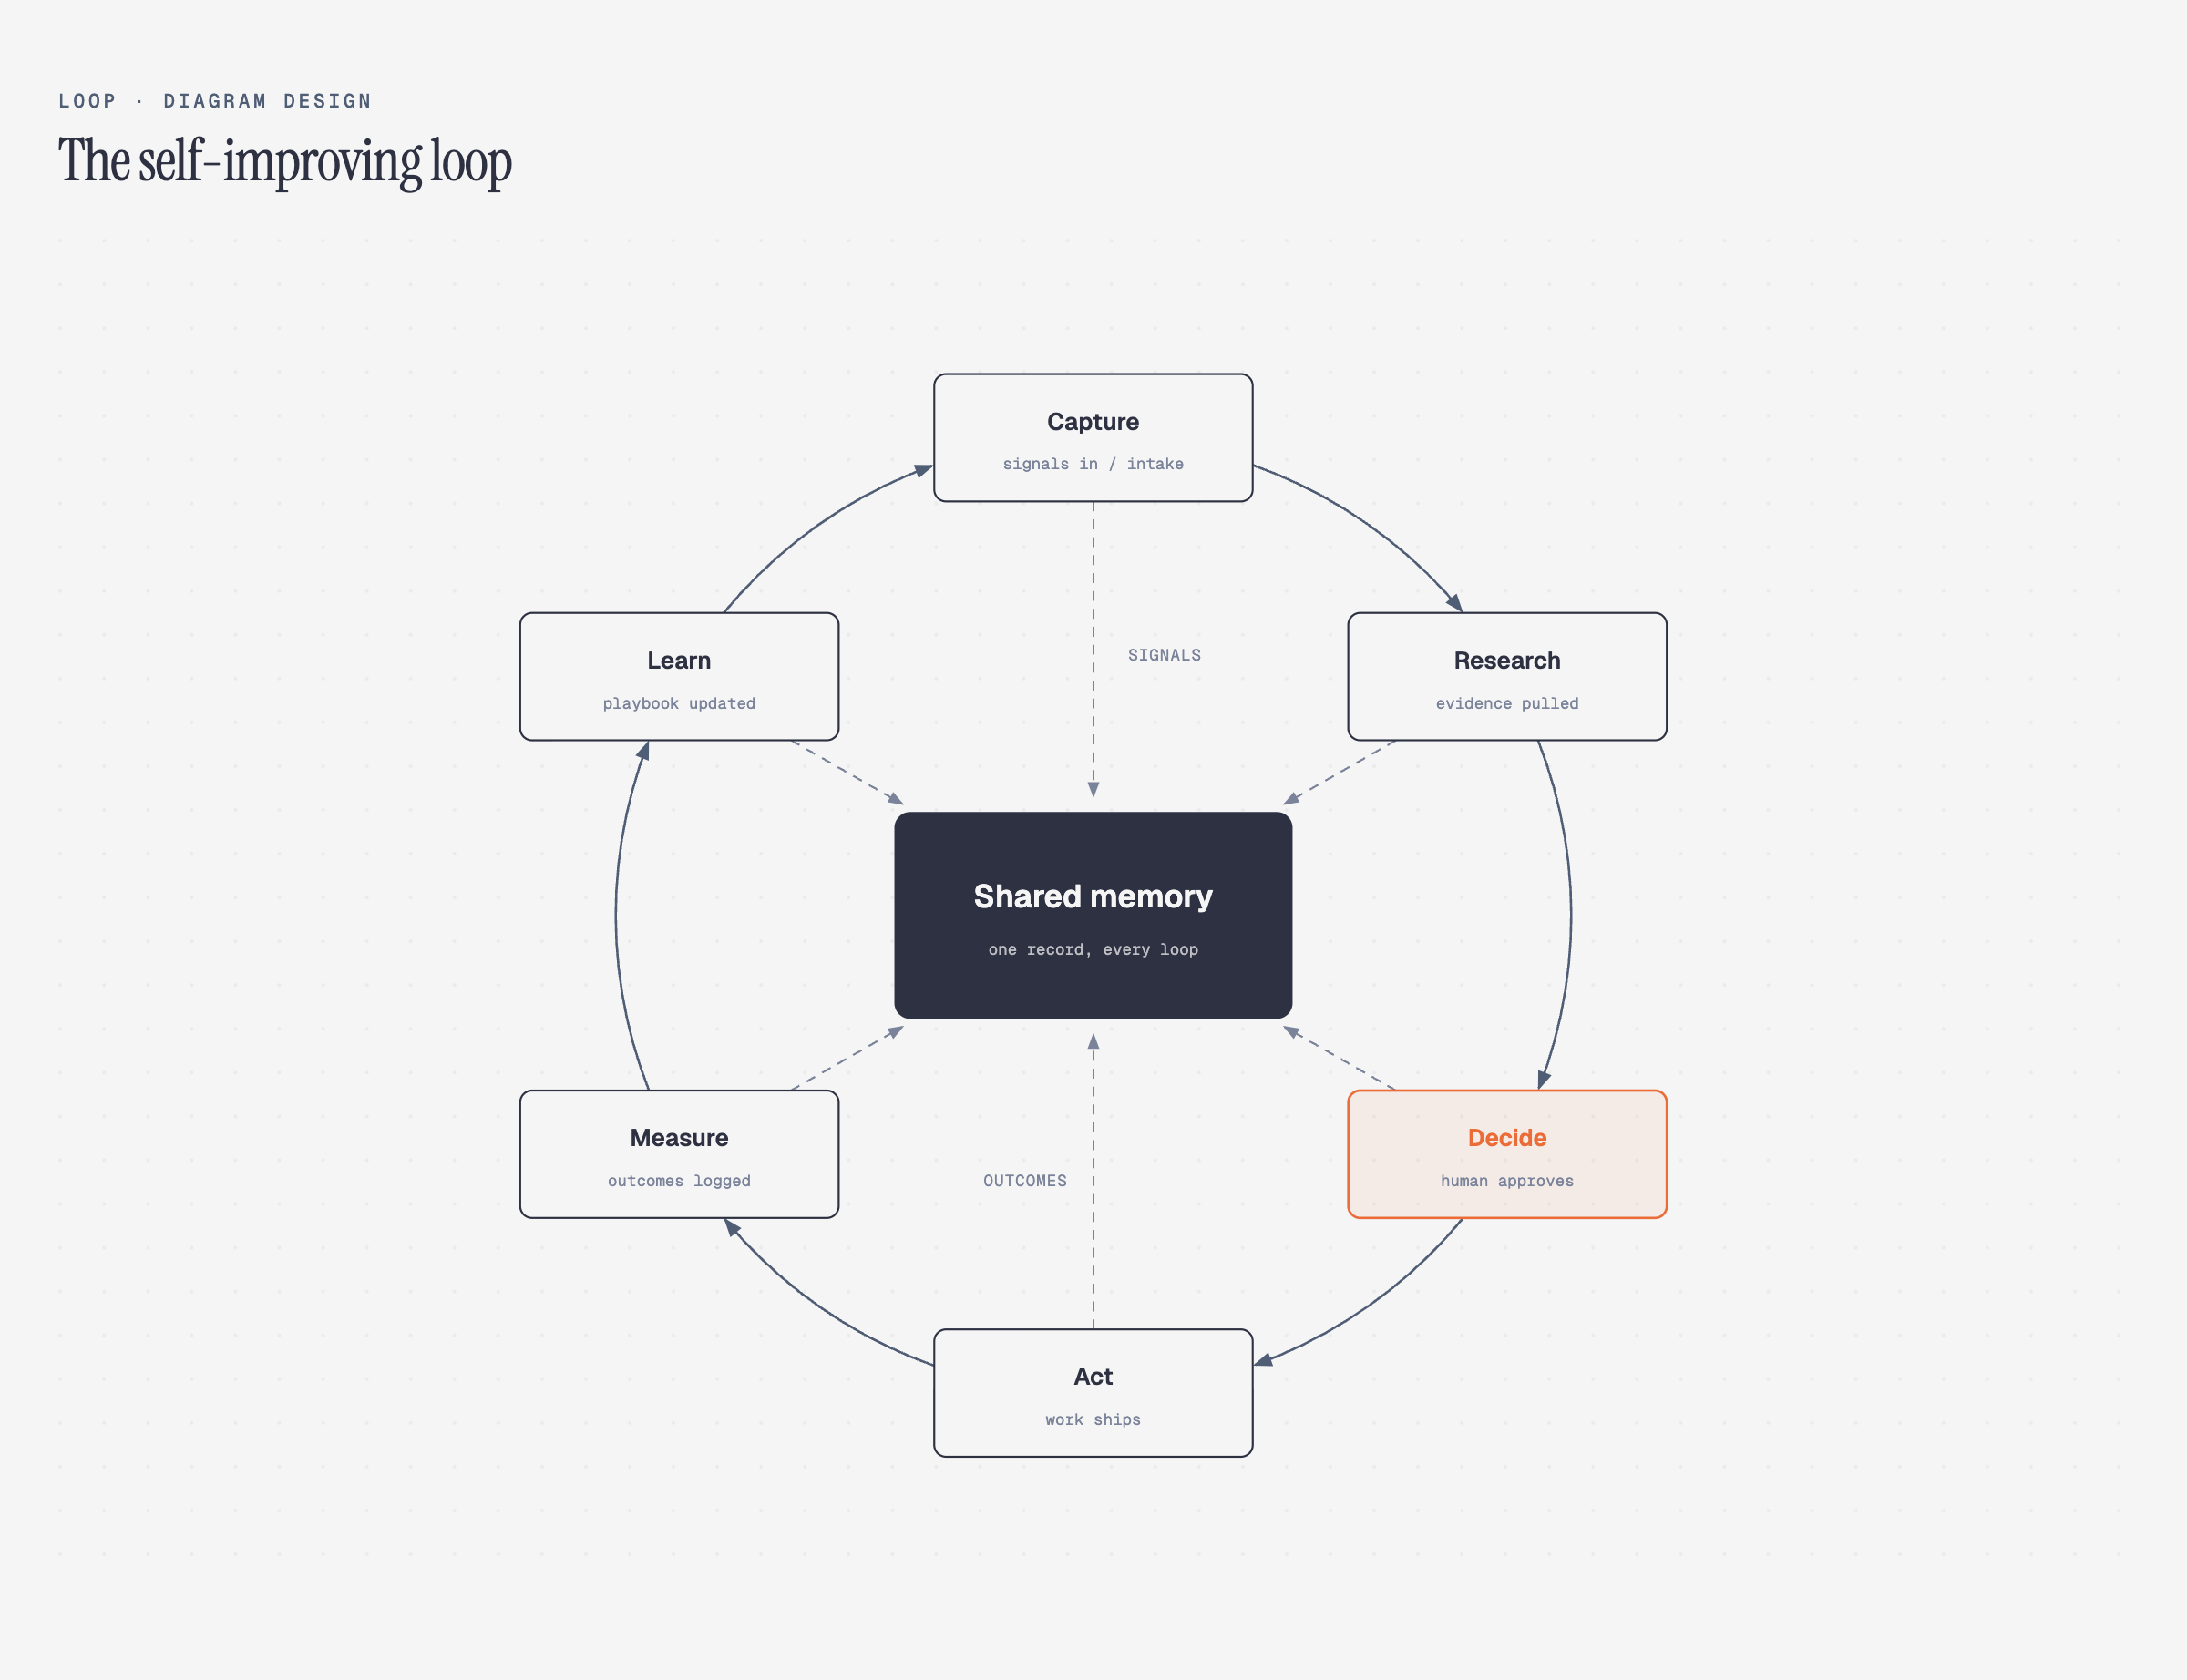
Why Change the Approach to Diagram Generation
The main idea behind the project is strict design rules. A regular prompt produces chaotic blocks. A set of diagram-design rules forces the model to adhere to a grid with 4-pixel multiples, control element density, and use the accent color only for 1–2 main nodes.
You don't need to learn new DSLs or figure out syntax. You ask the agent to show the service architecture, and it outputs a ready HTML file with embedded SVG. You can open it directly in the browser, paste it into an article, or import it into a presentation.
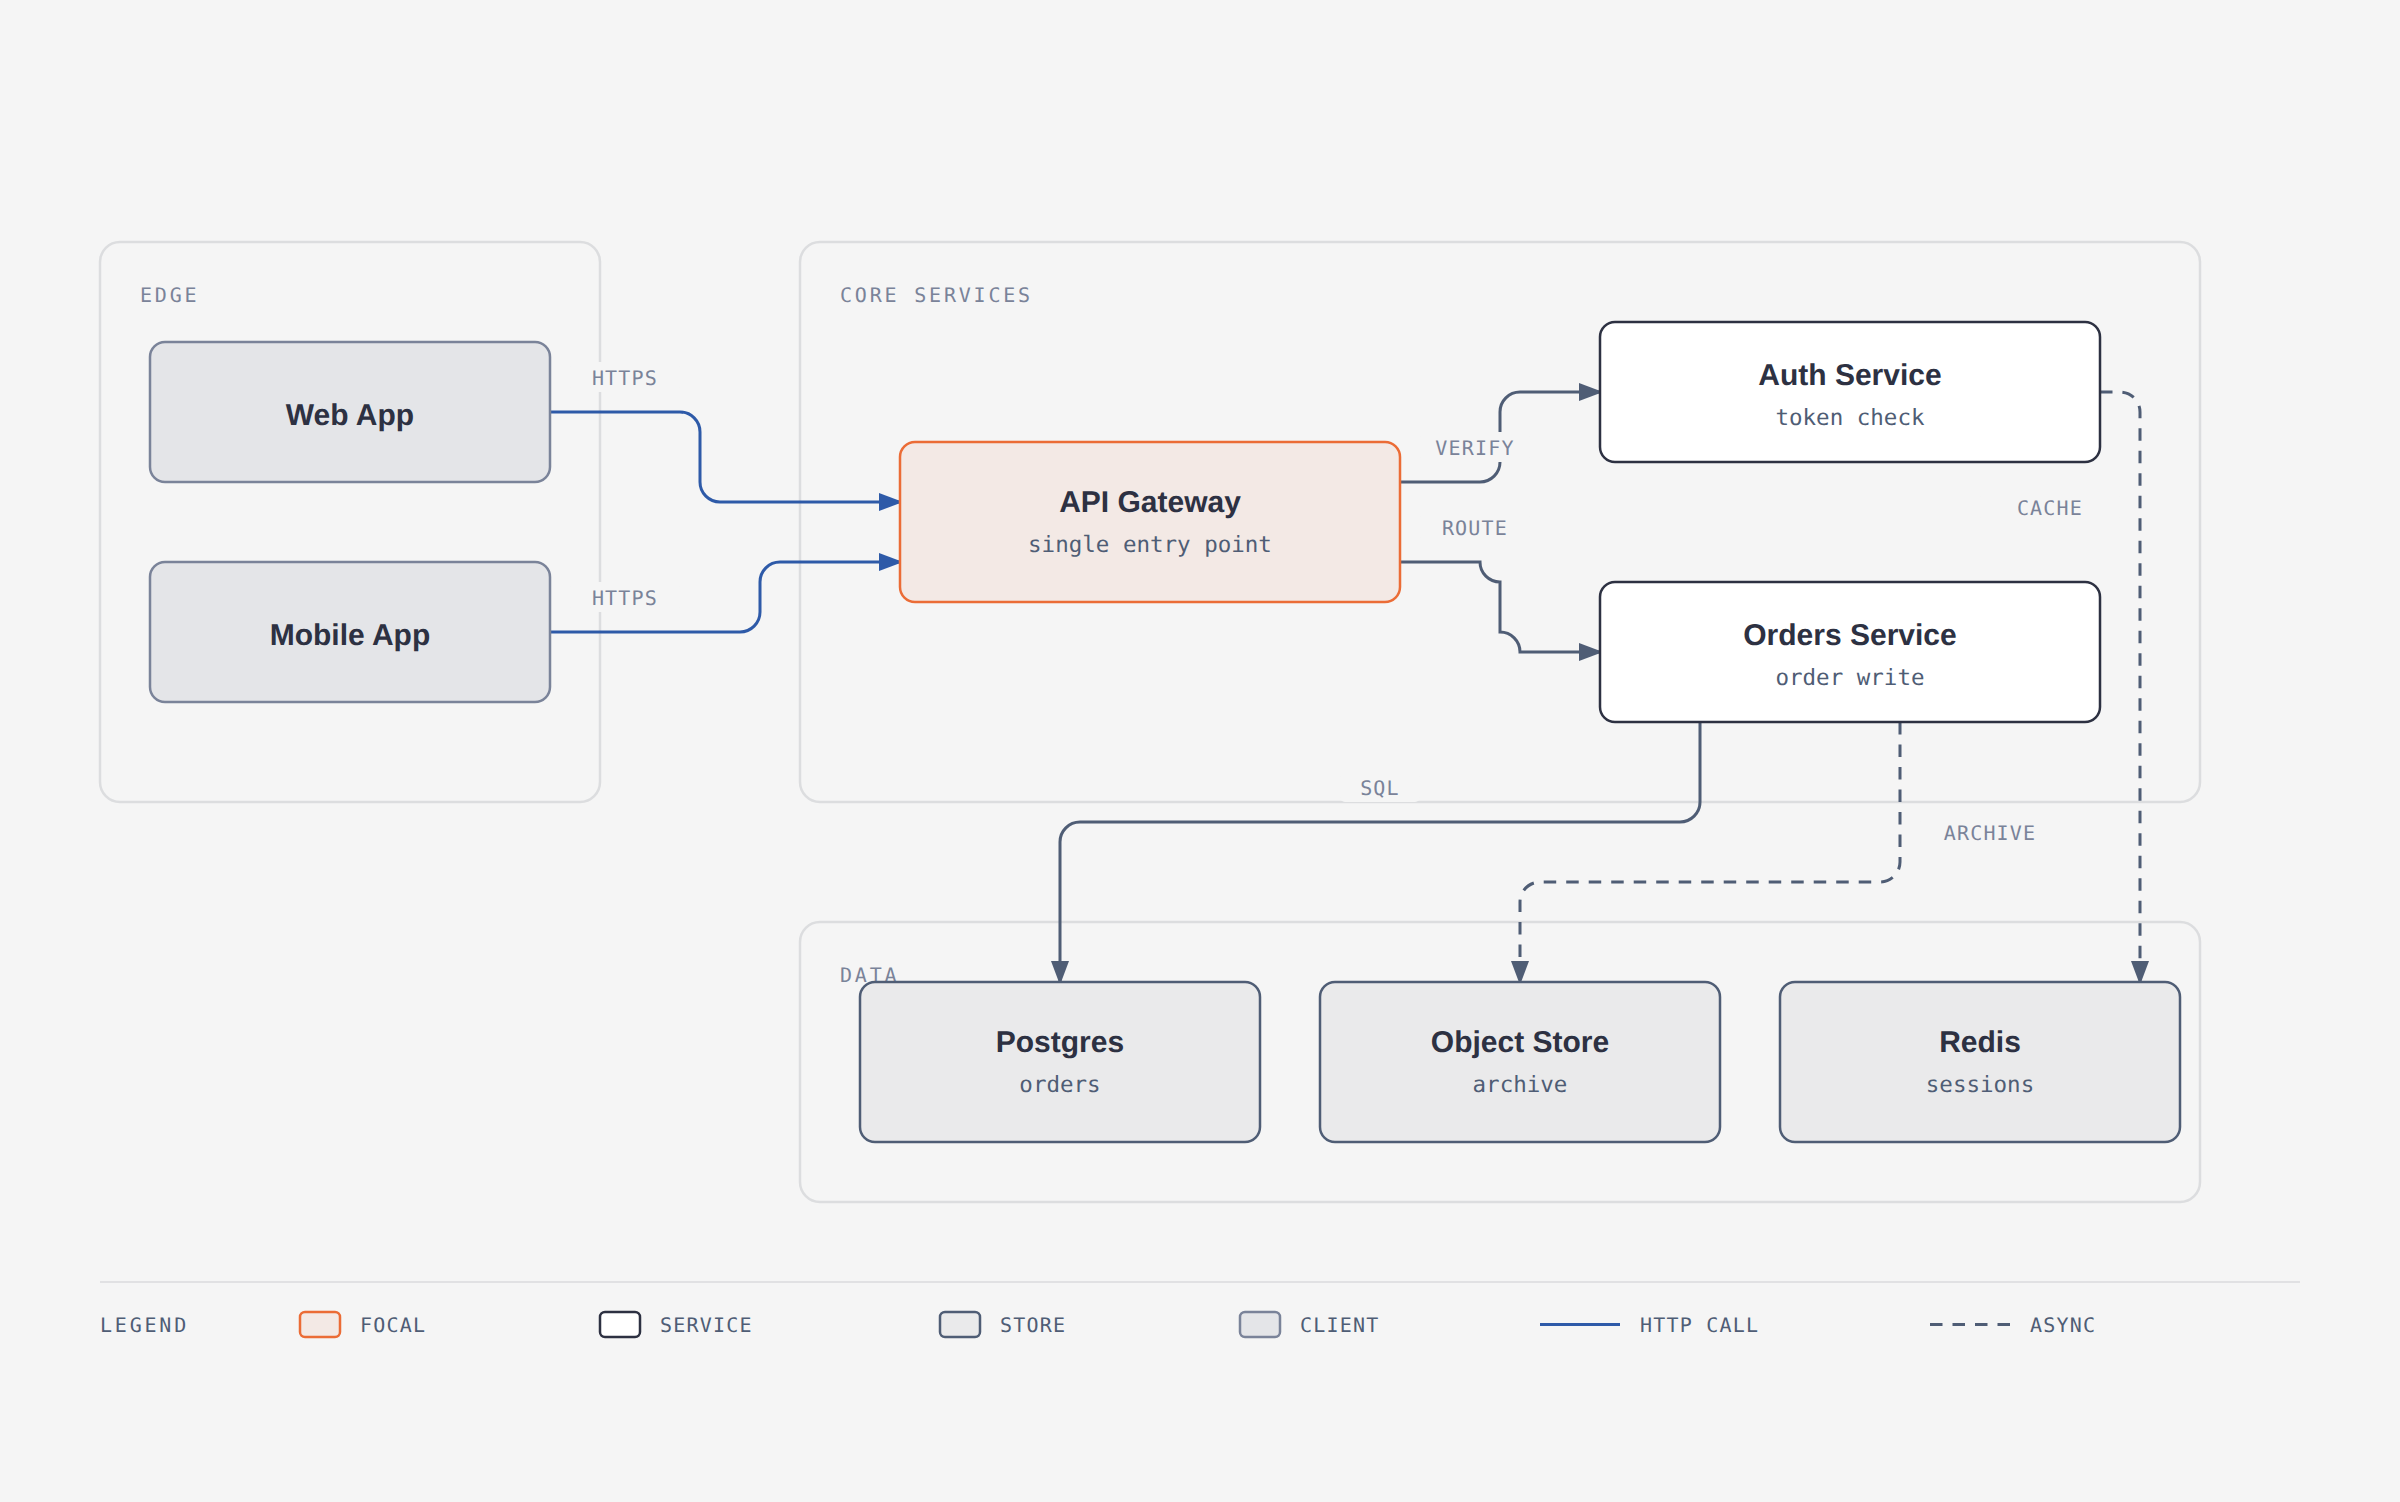
Four Main Features of the Tool
The first feature is automatic brand onboarding. You give the agent a command with a link to your site. The script downloads the main page, parses the styles, finds background, text, and accent colors, and then reads the fonts. Before saving the settings, the tool automatically checks contrast against the WCAG AA standard. If the text color is hard to read on the chosen background, the system will suggest an adjusted palette.
The second feature is redrawing existing diagrams. If you have .drawio, .mmd files, or Mermaid diagrams directly inside Markdown, you send them to the agent. The tool reworks the diagram for the specified format and audience:
- Format changes based on the task: SVG for Figma, PNG for slides, or HTML for web pages.
- Size adjusts to the medium: from a narrow illustration in documentation to 16:9 format for presentations.
- Detail level controls the number of nodes: an original diagram with 20 blocks can automatically be reduced to 7 main elements.
- Complexity of wording adapts to the reader: technical terms like
Auth Service / JWT RS256get renamed to something managers can understand, likeSign-in.
The third feature is support for 27 visualization types. The gallery has everything: architectural diagrams, ER diagrams, sequence diagrams, timelines, 2x2 matrices, and funnels.
The fourth feature is built-in accessibility. Generated SVG files contain role="img" tags, valid aria-labelledby attributes, and unique identifier prefixes. Multiple such SVGs can be safely embedded on a single page without DOM conflicts.
Examples of Available Visualization Types
Each of the 27 diagram types comes in three style variants: light minimalist, dark minimalist, and full editorial with description cards.
Architecture Components + connections |
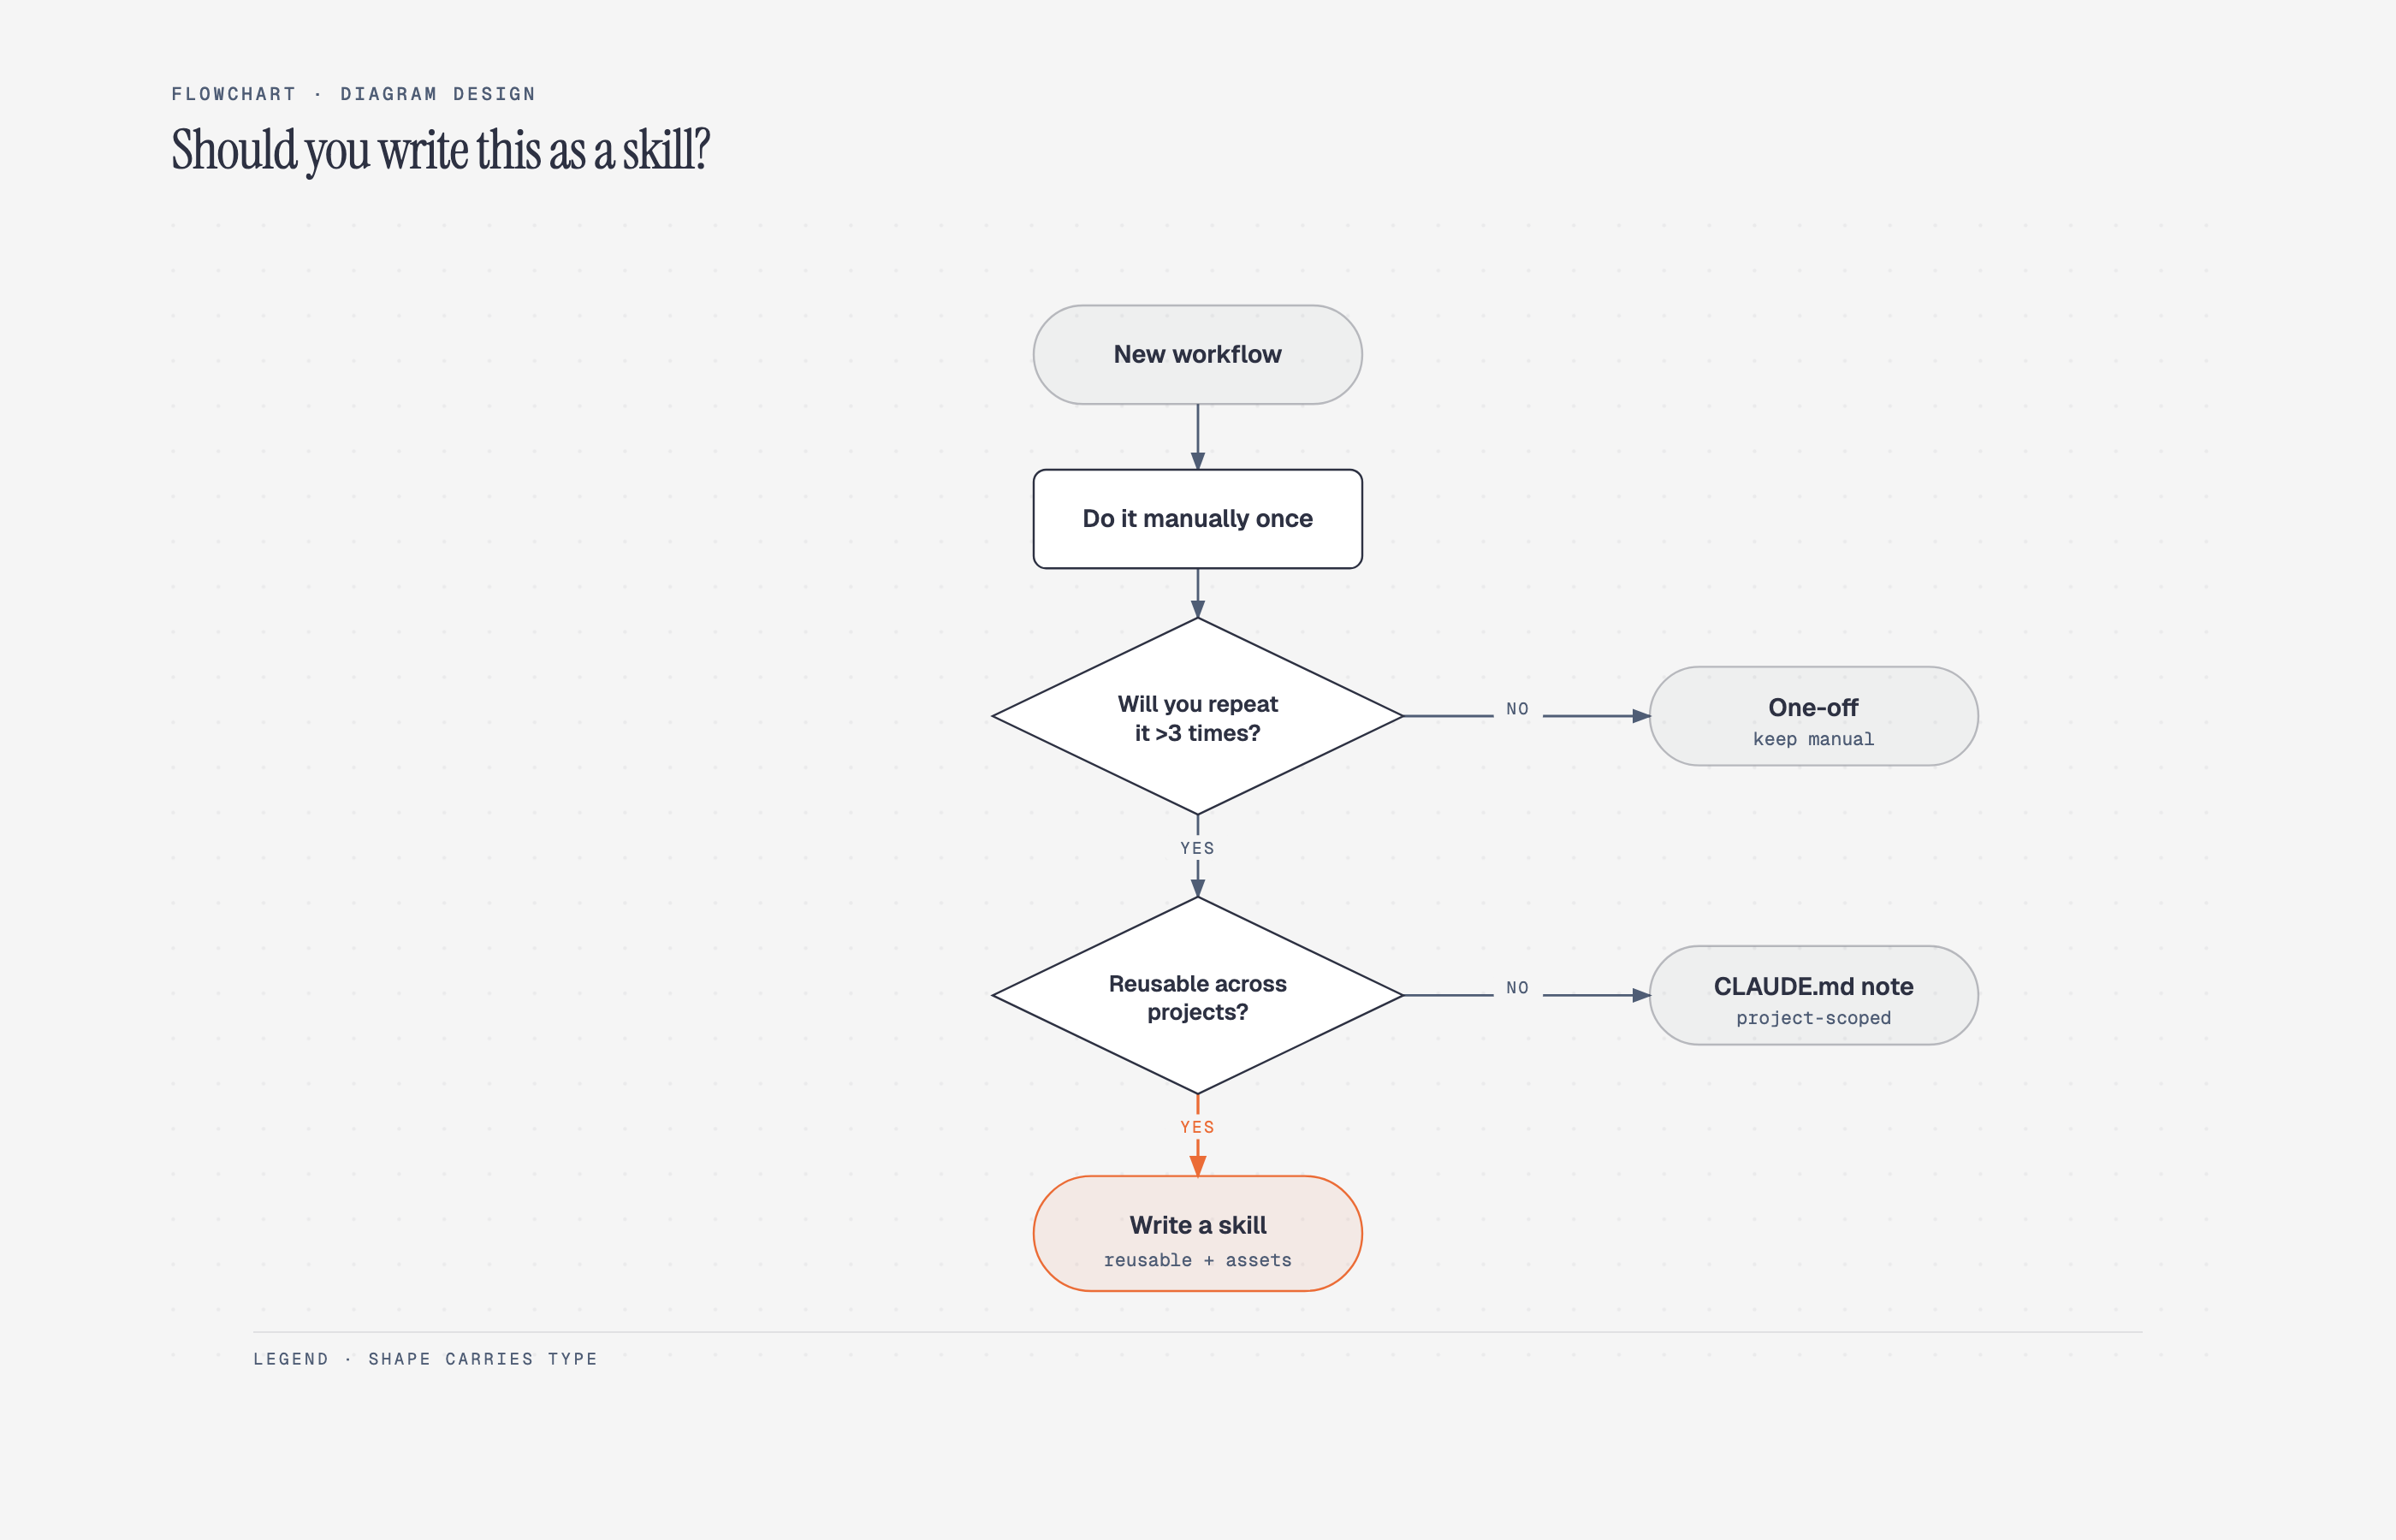 Flowchart Decision logic |
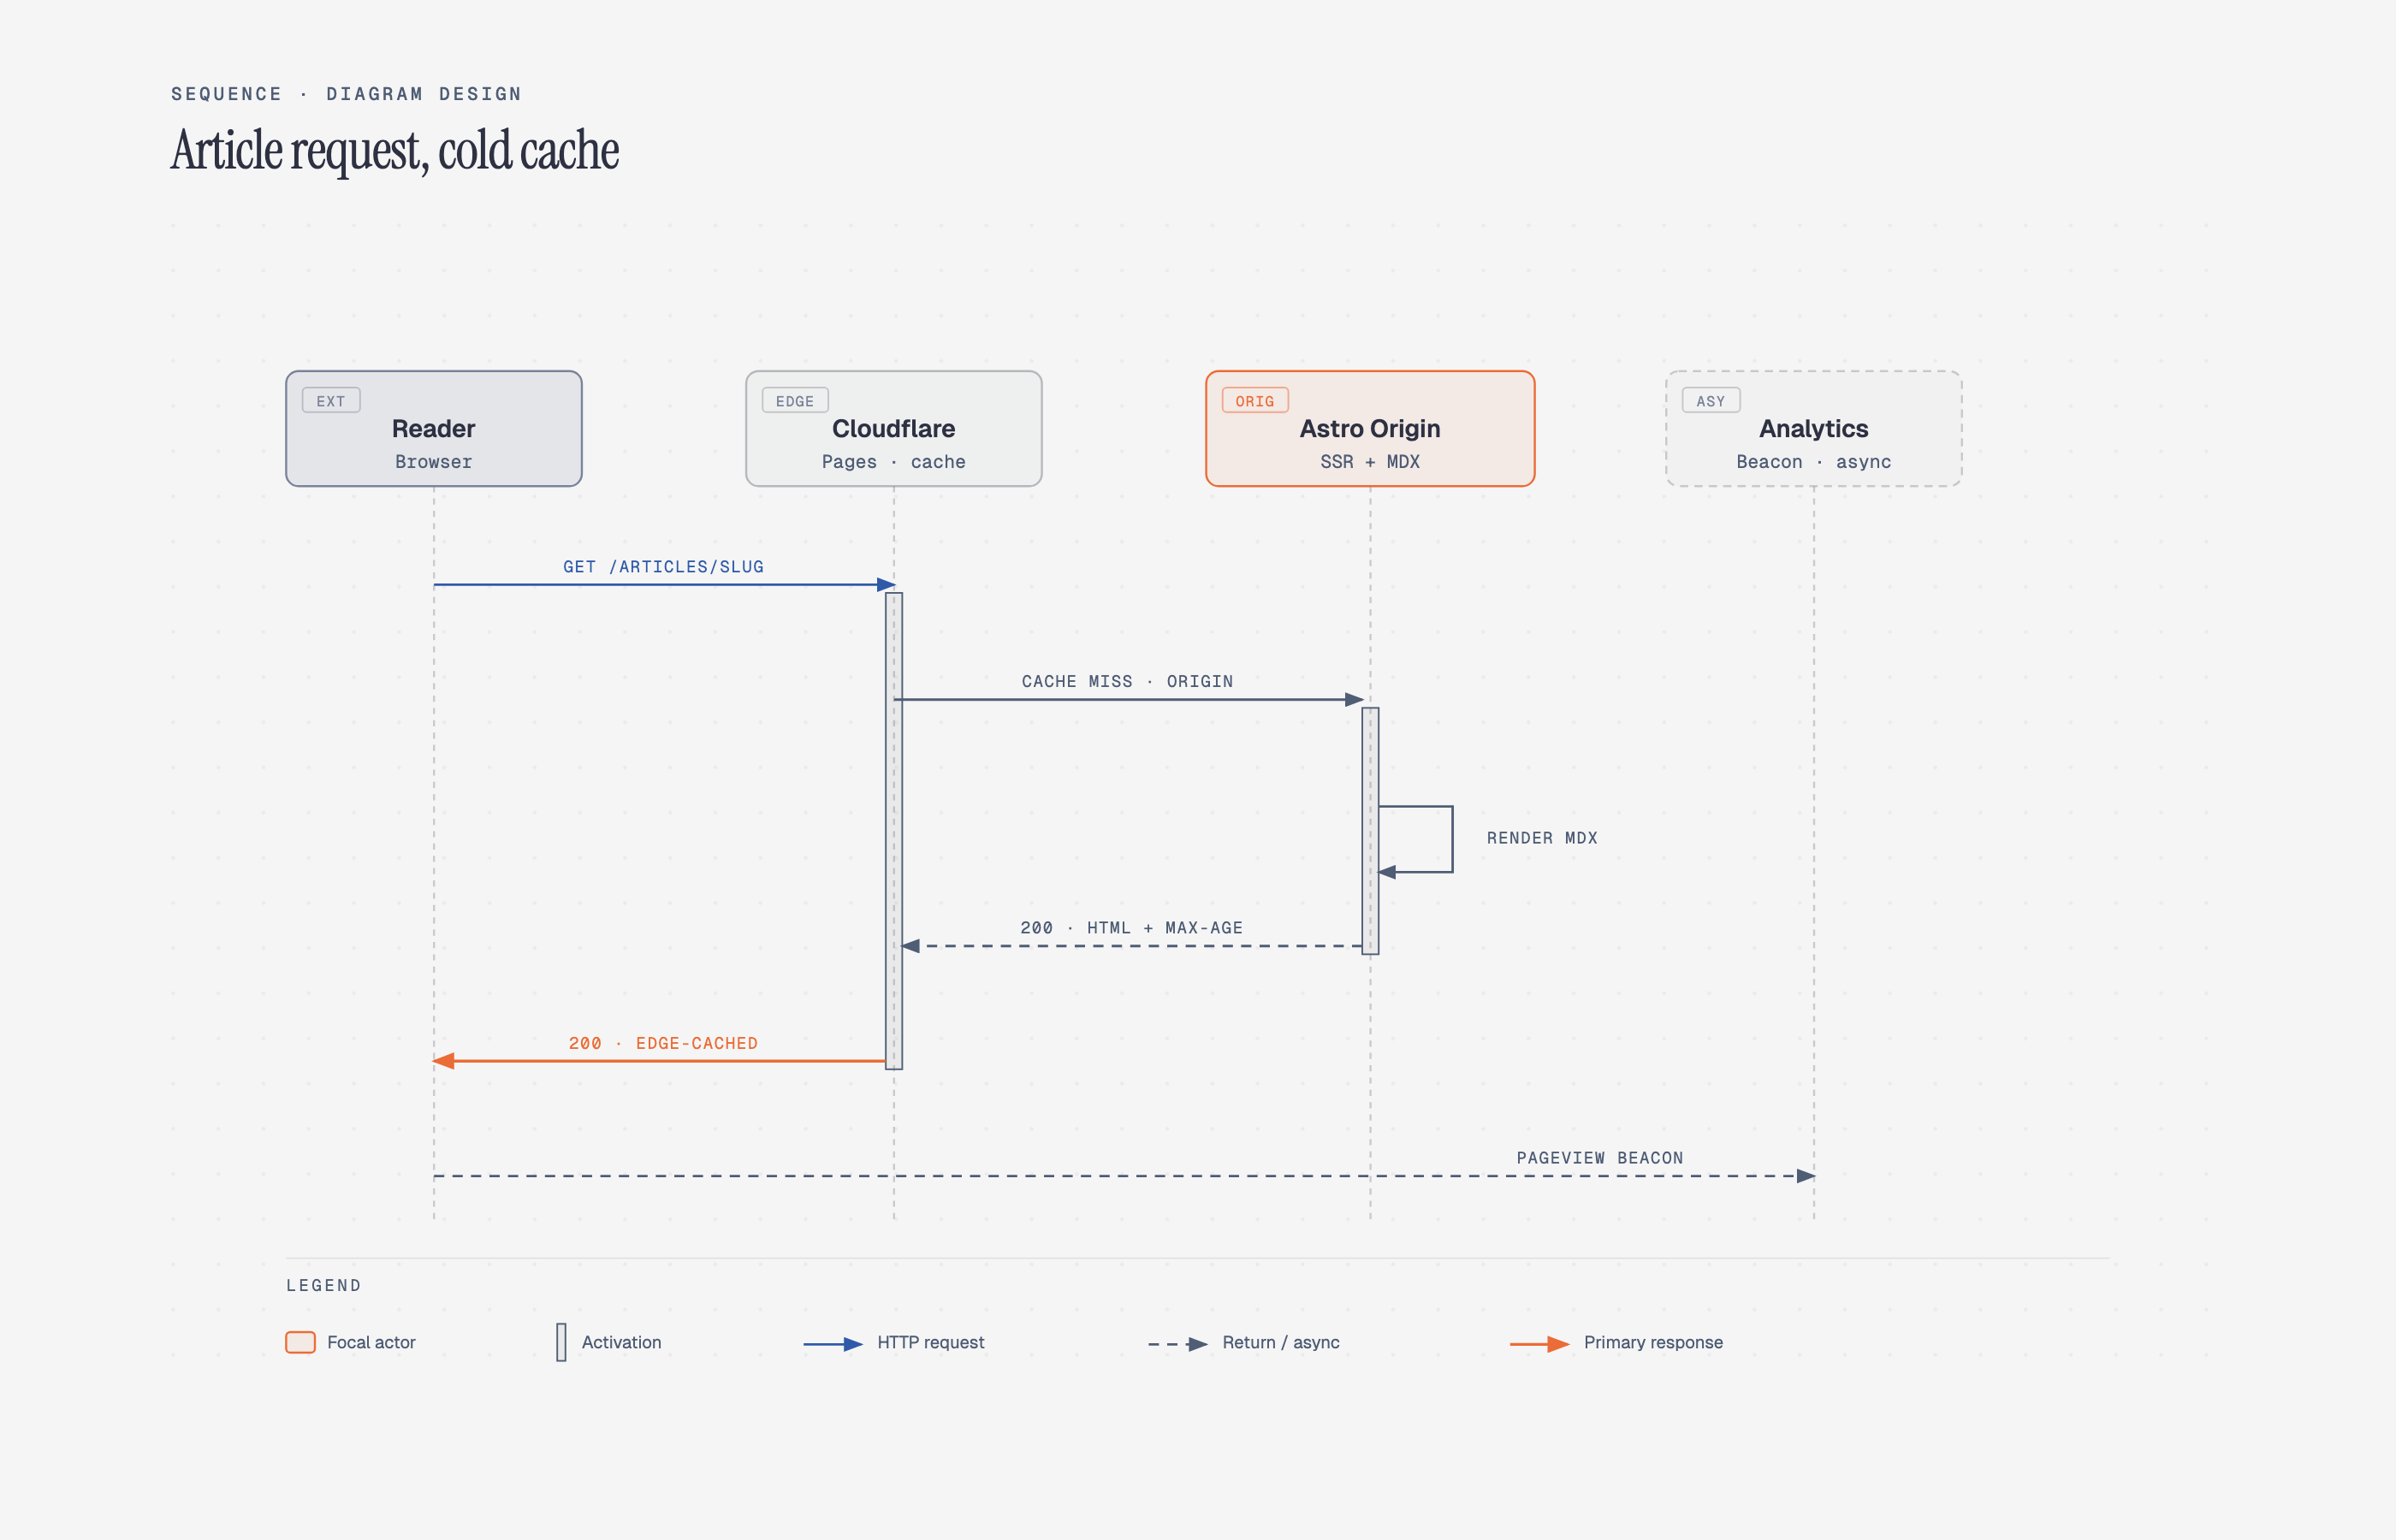 Sequence Messages over time |
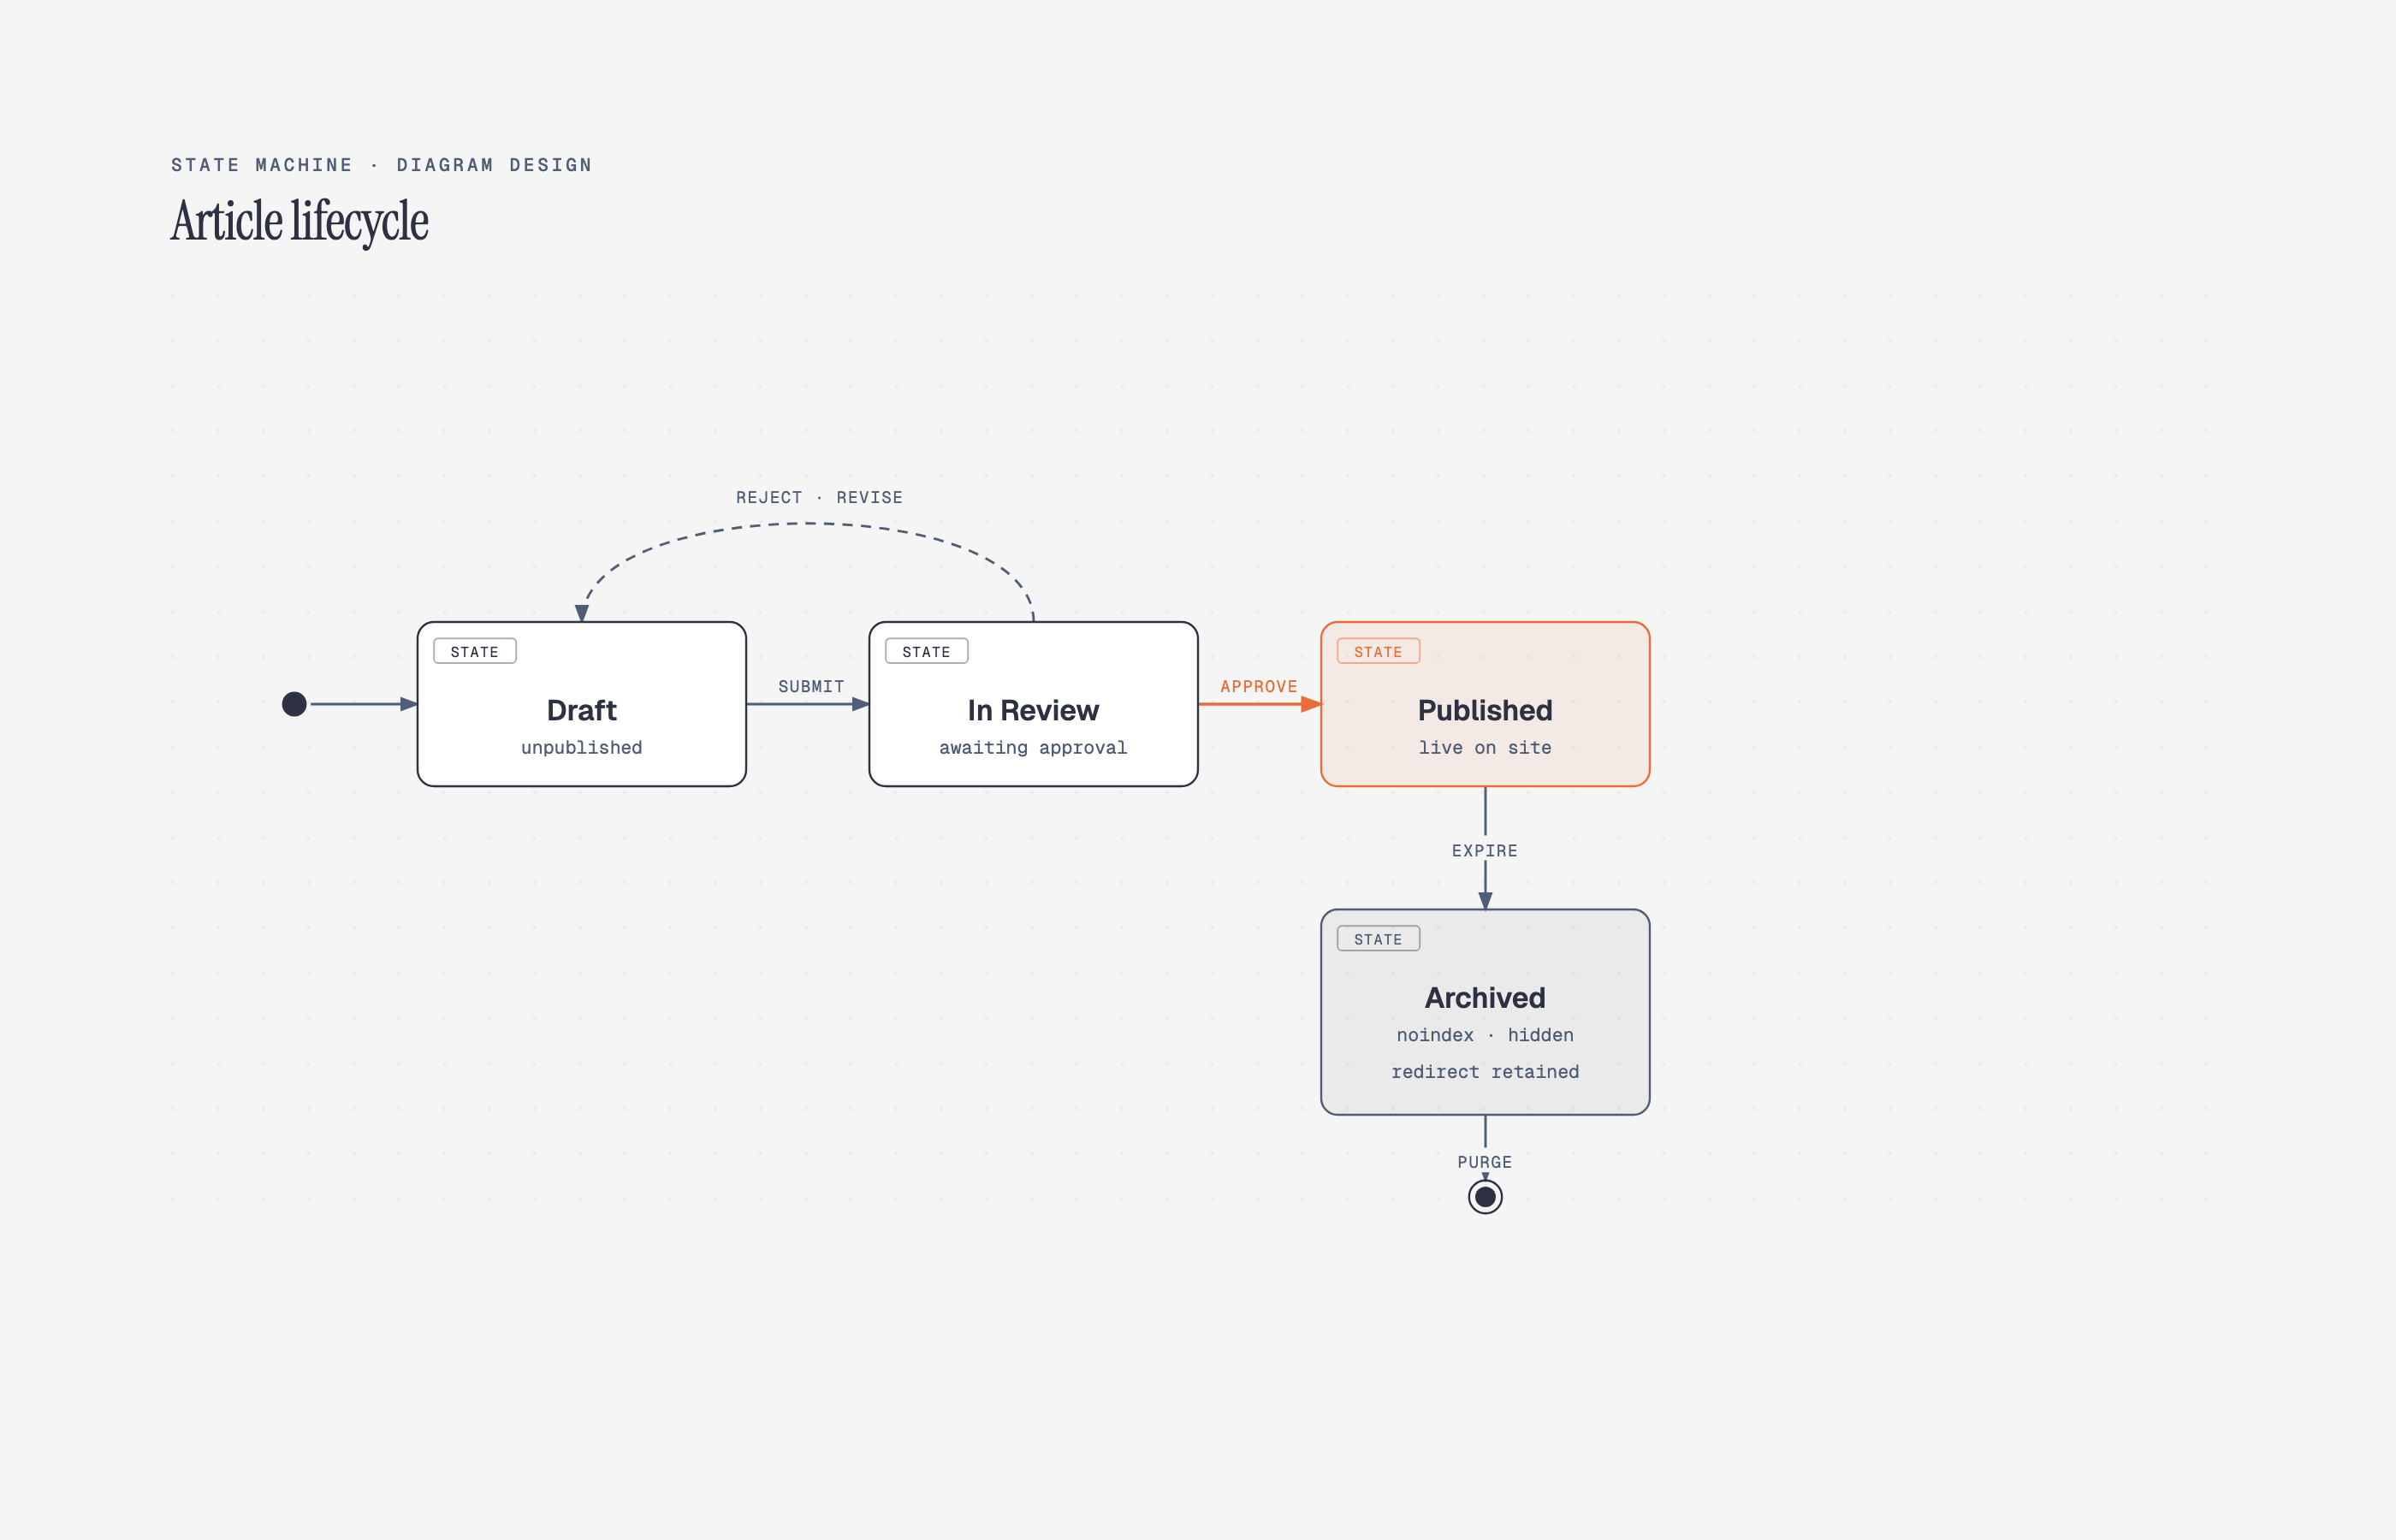 State machine States + transitions |
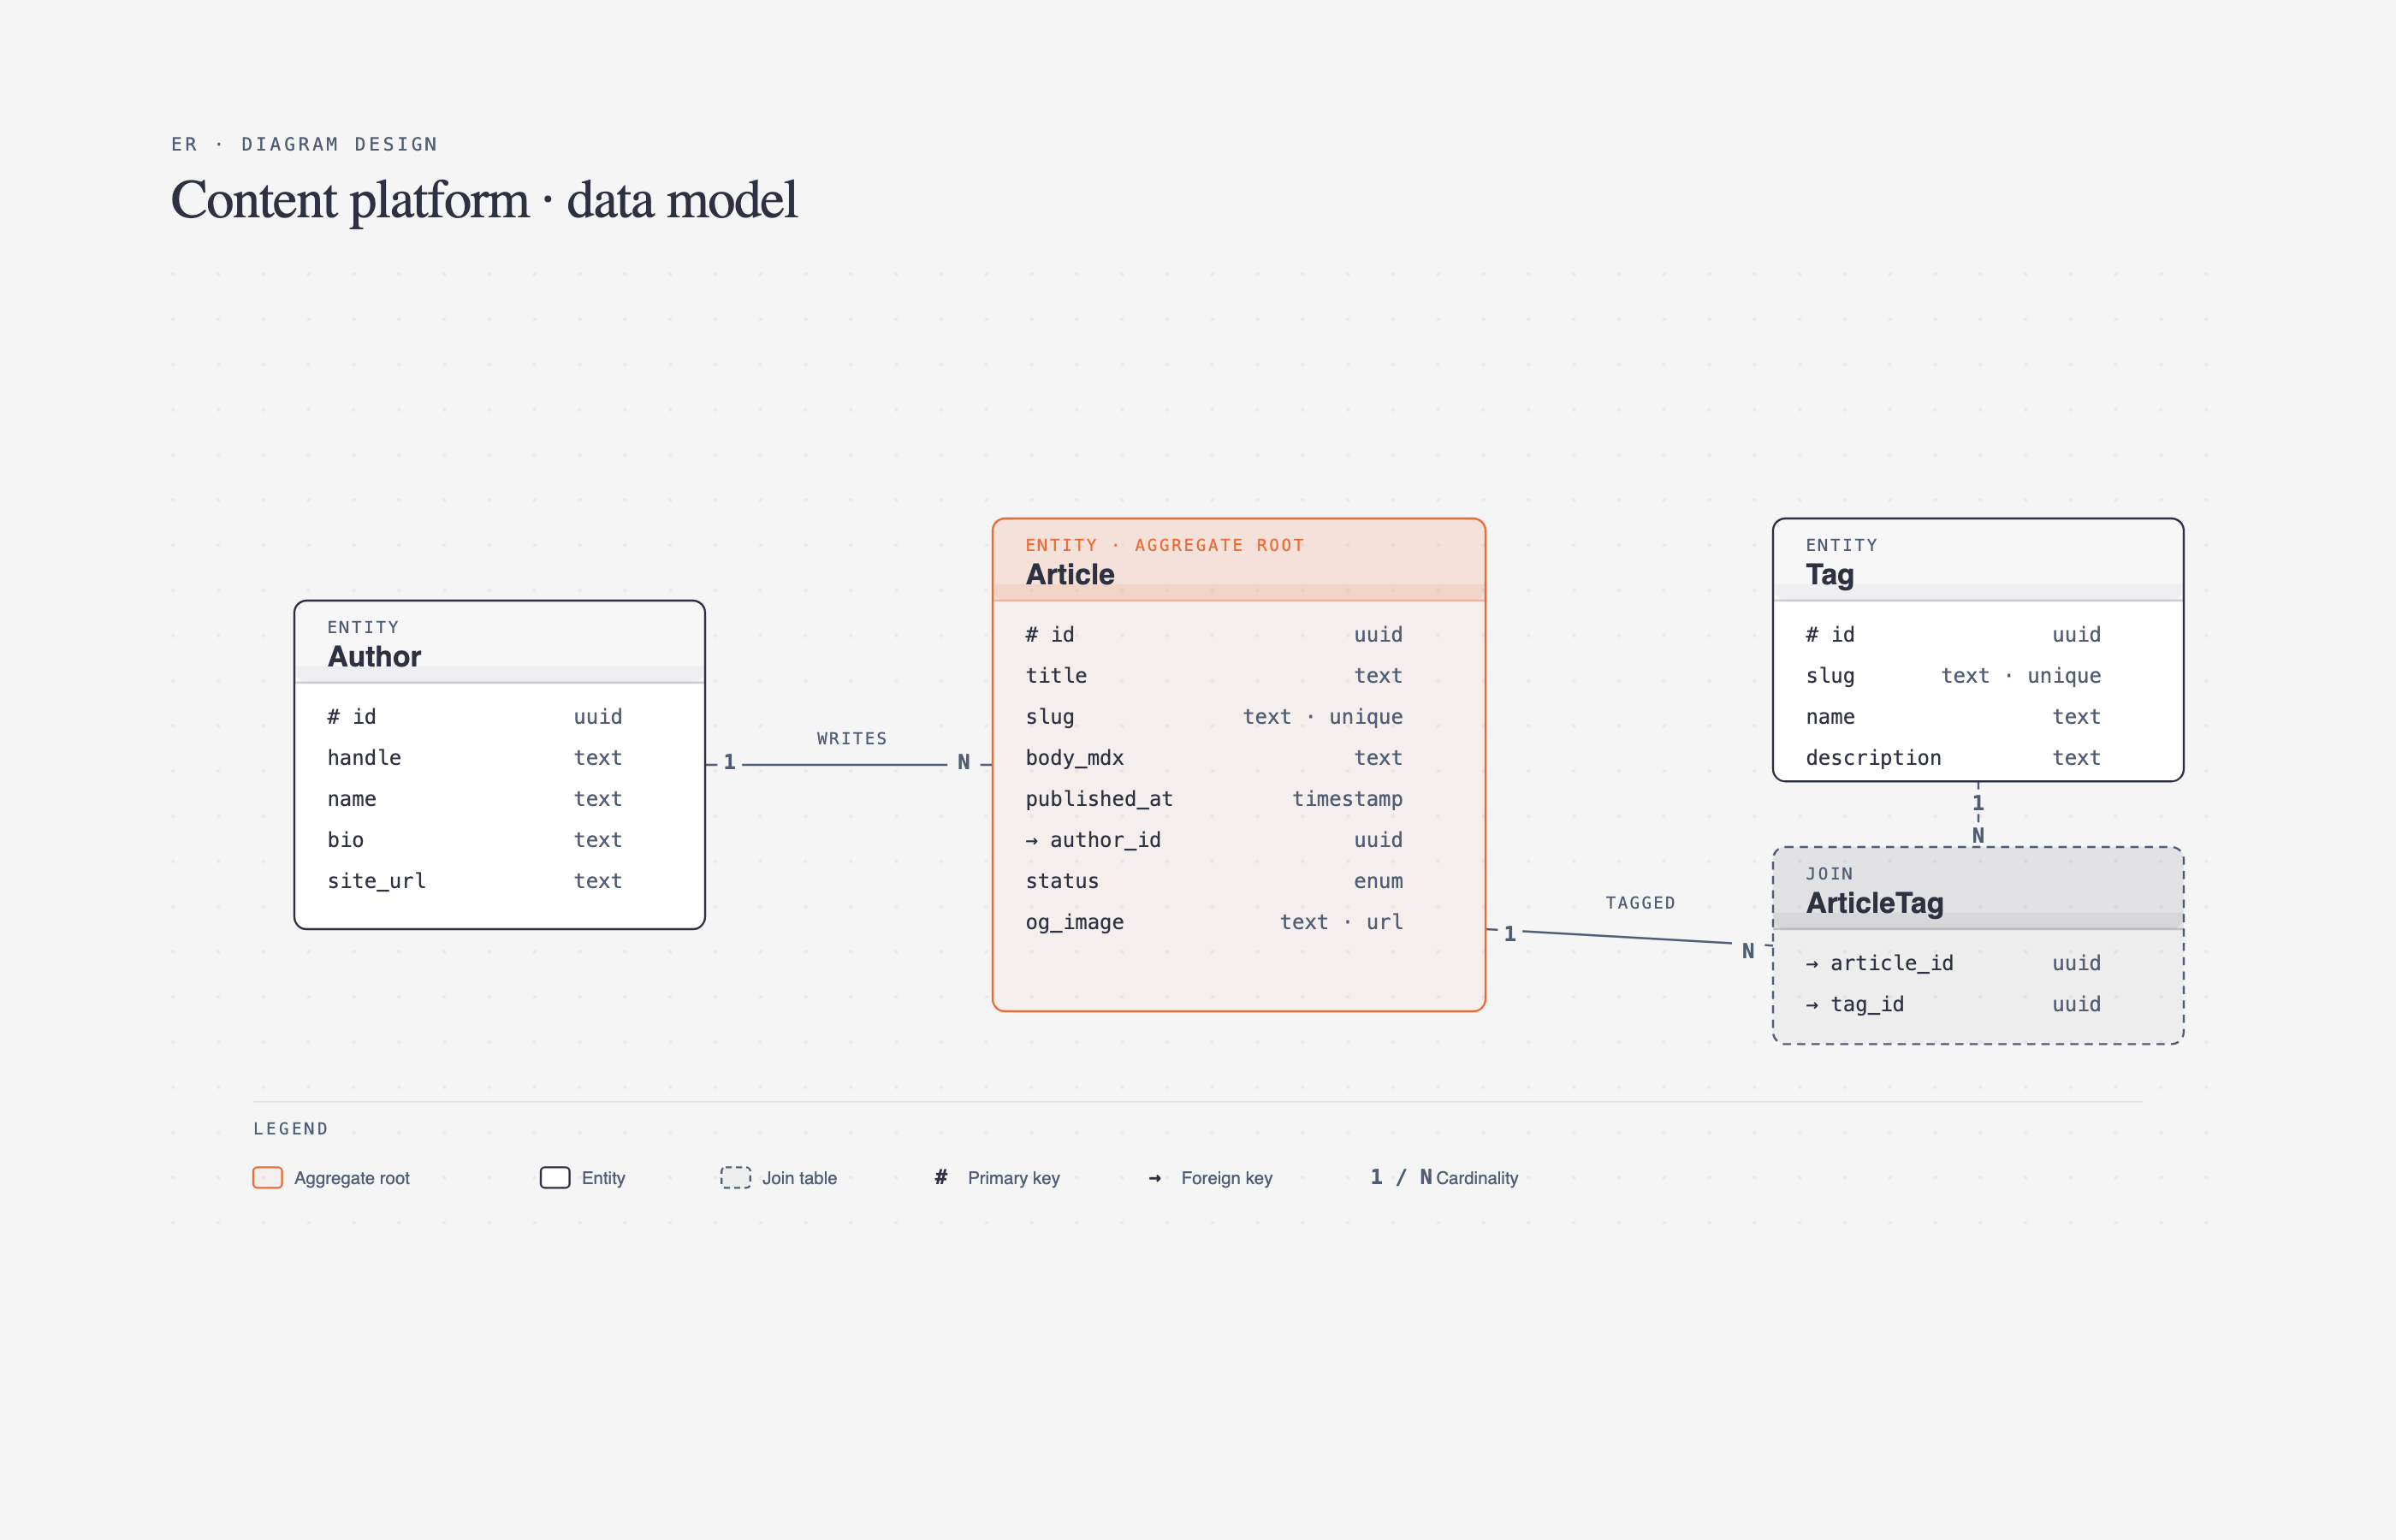 ER / data model Entities + fields |
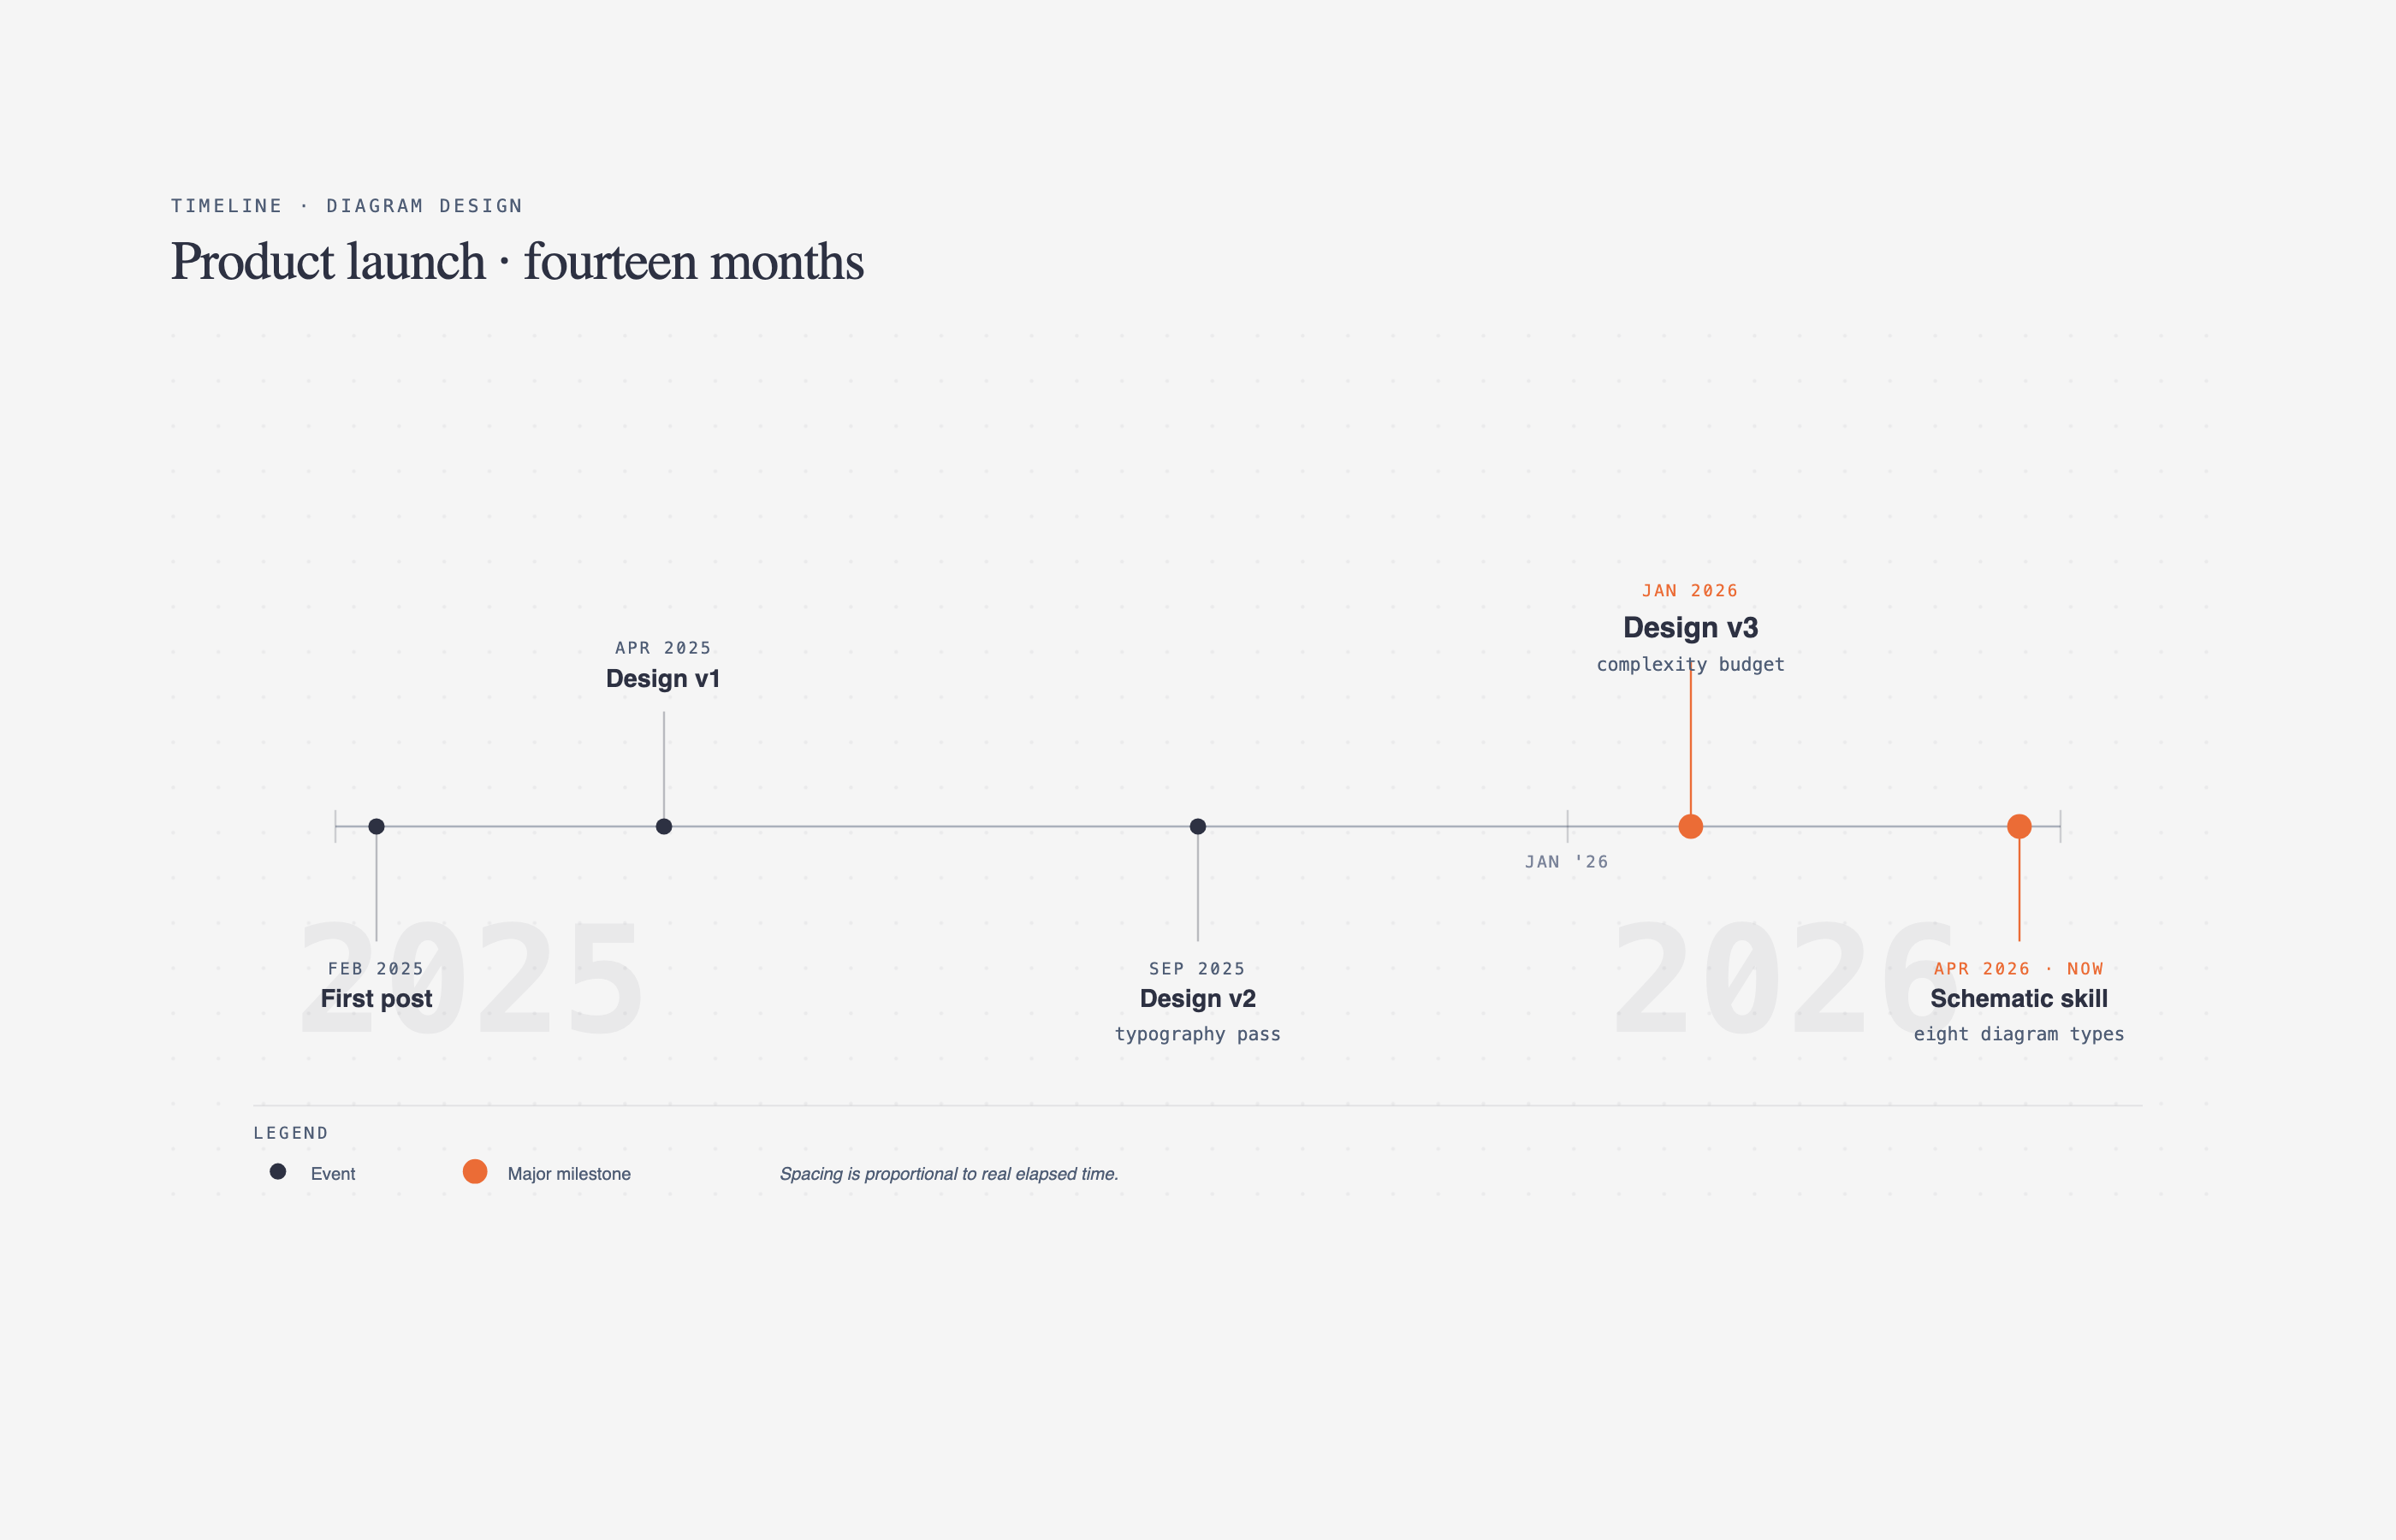 Timeline Events on an axis |
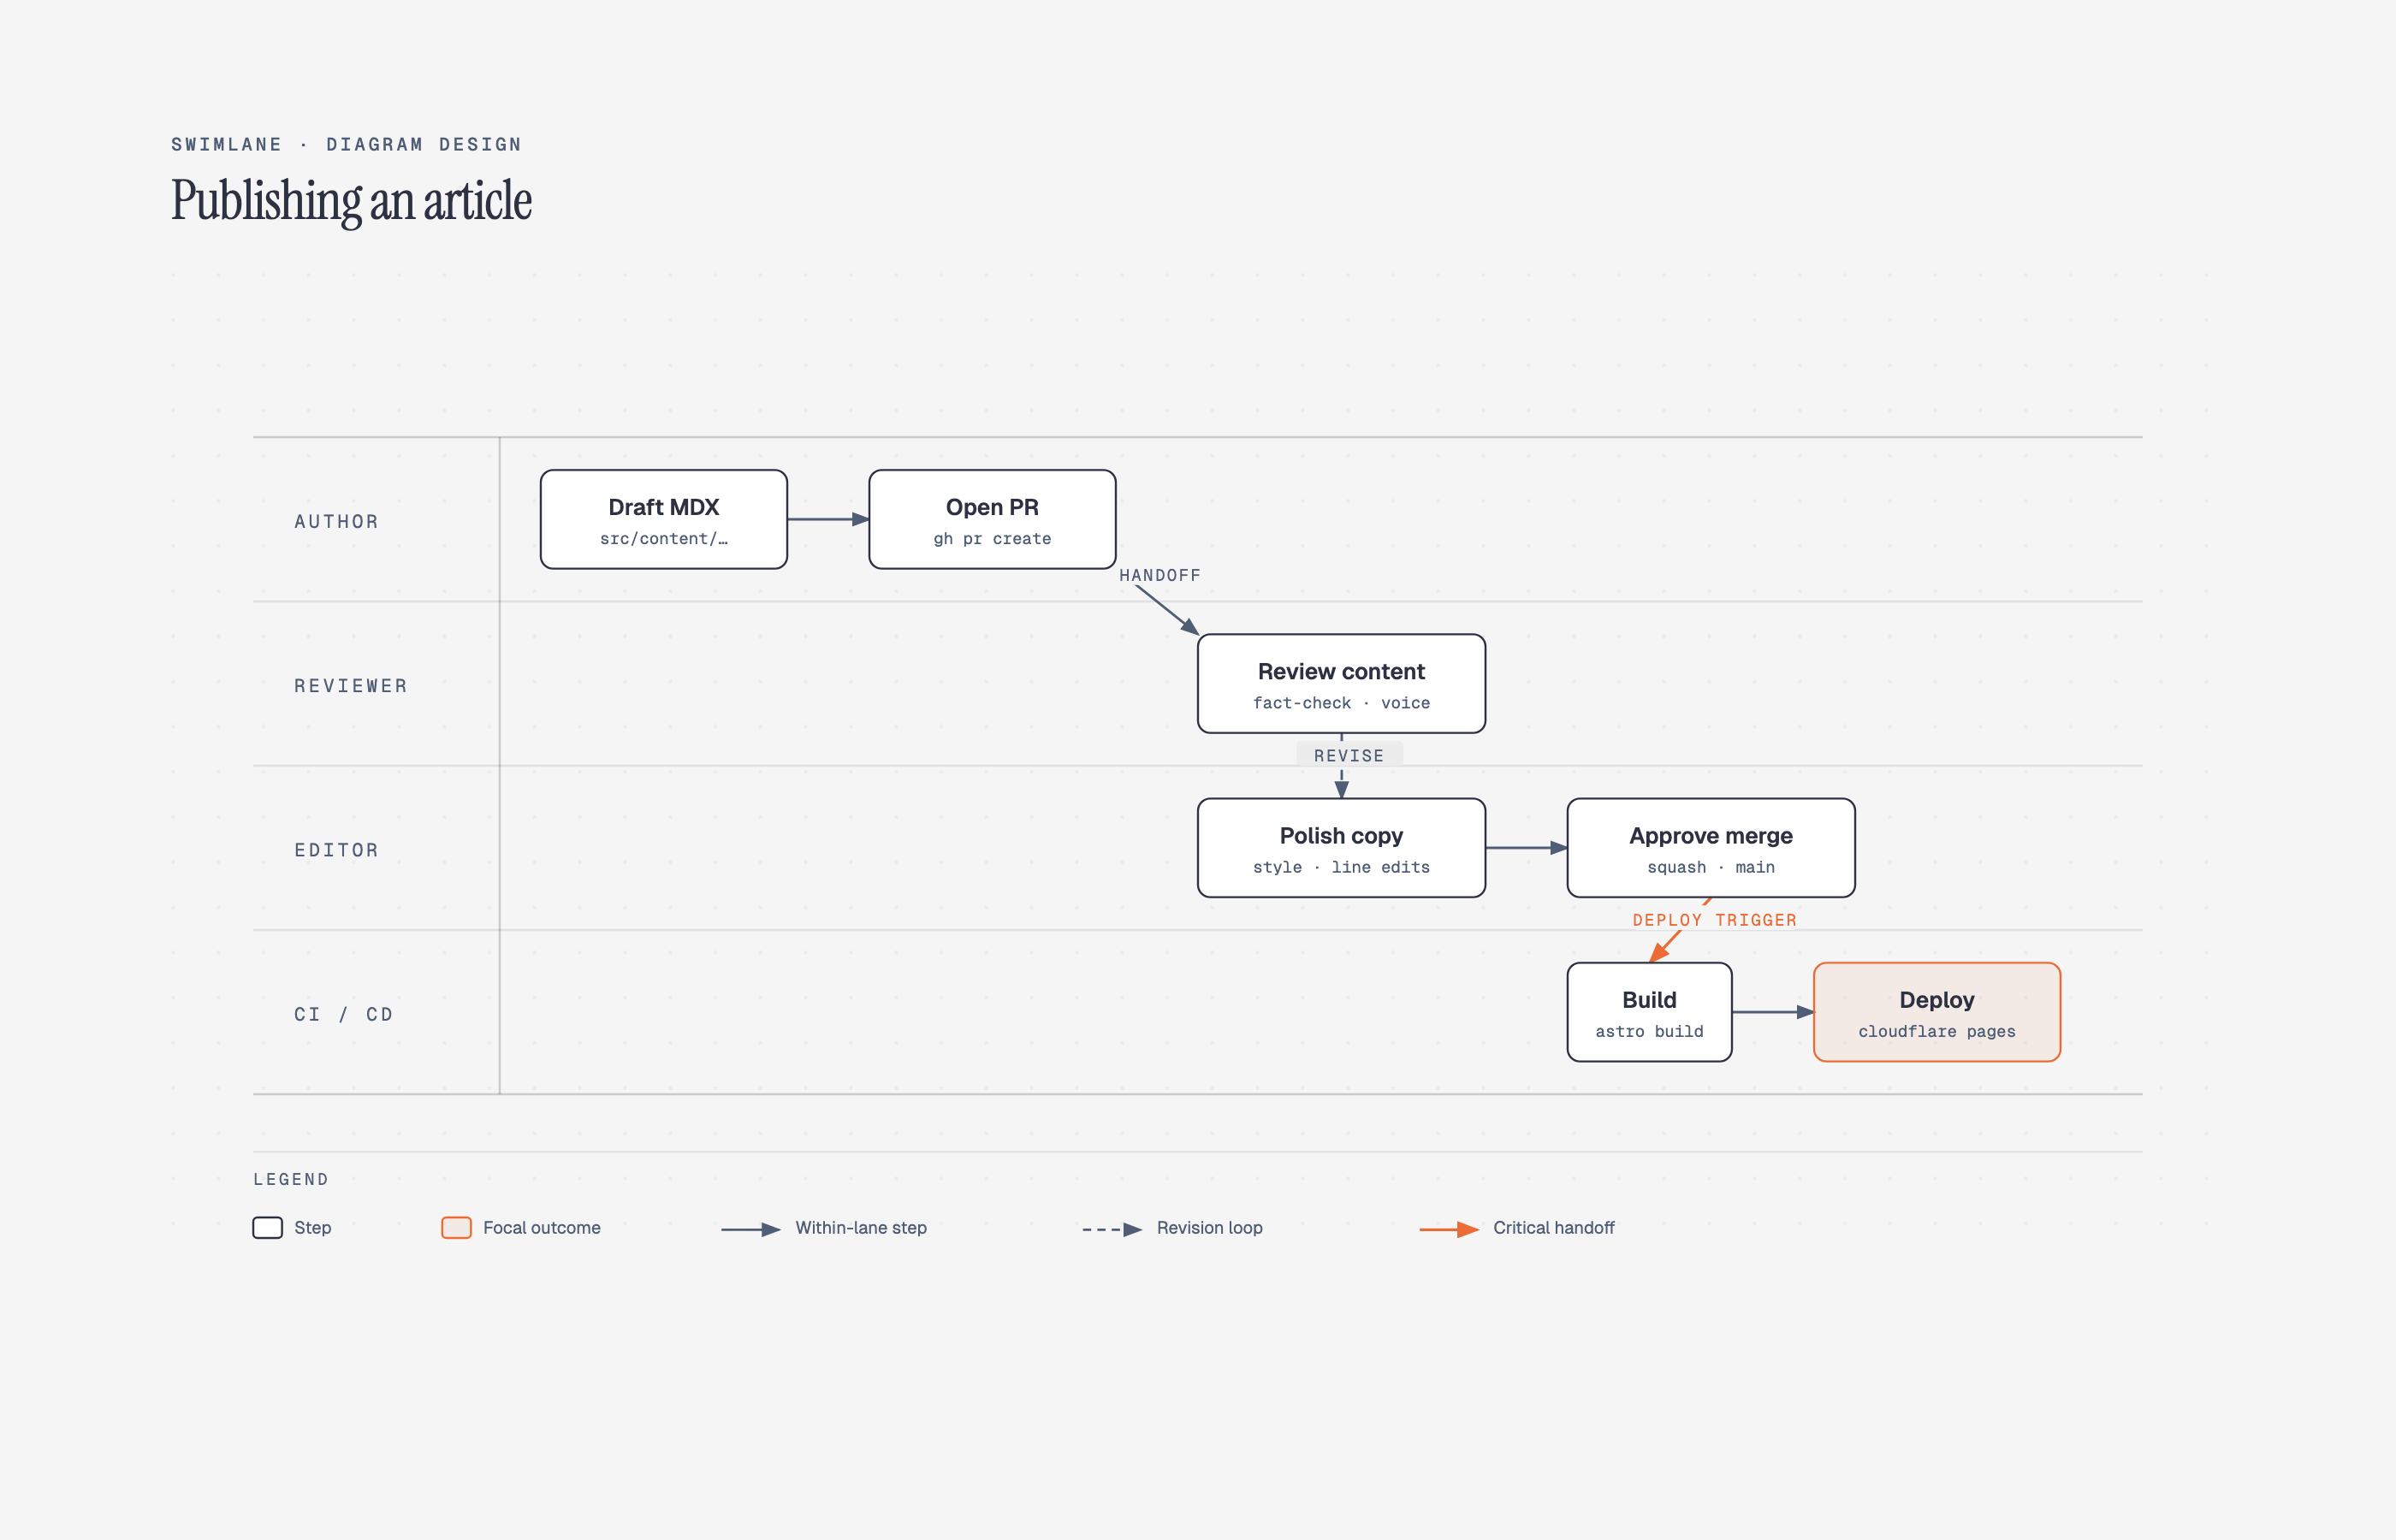 Swimlane Cross-functional flow |
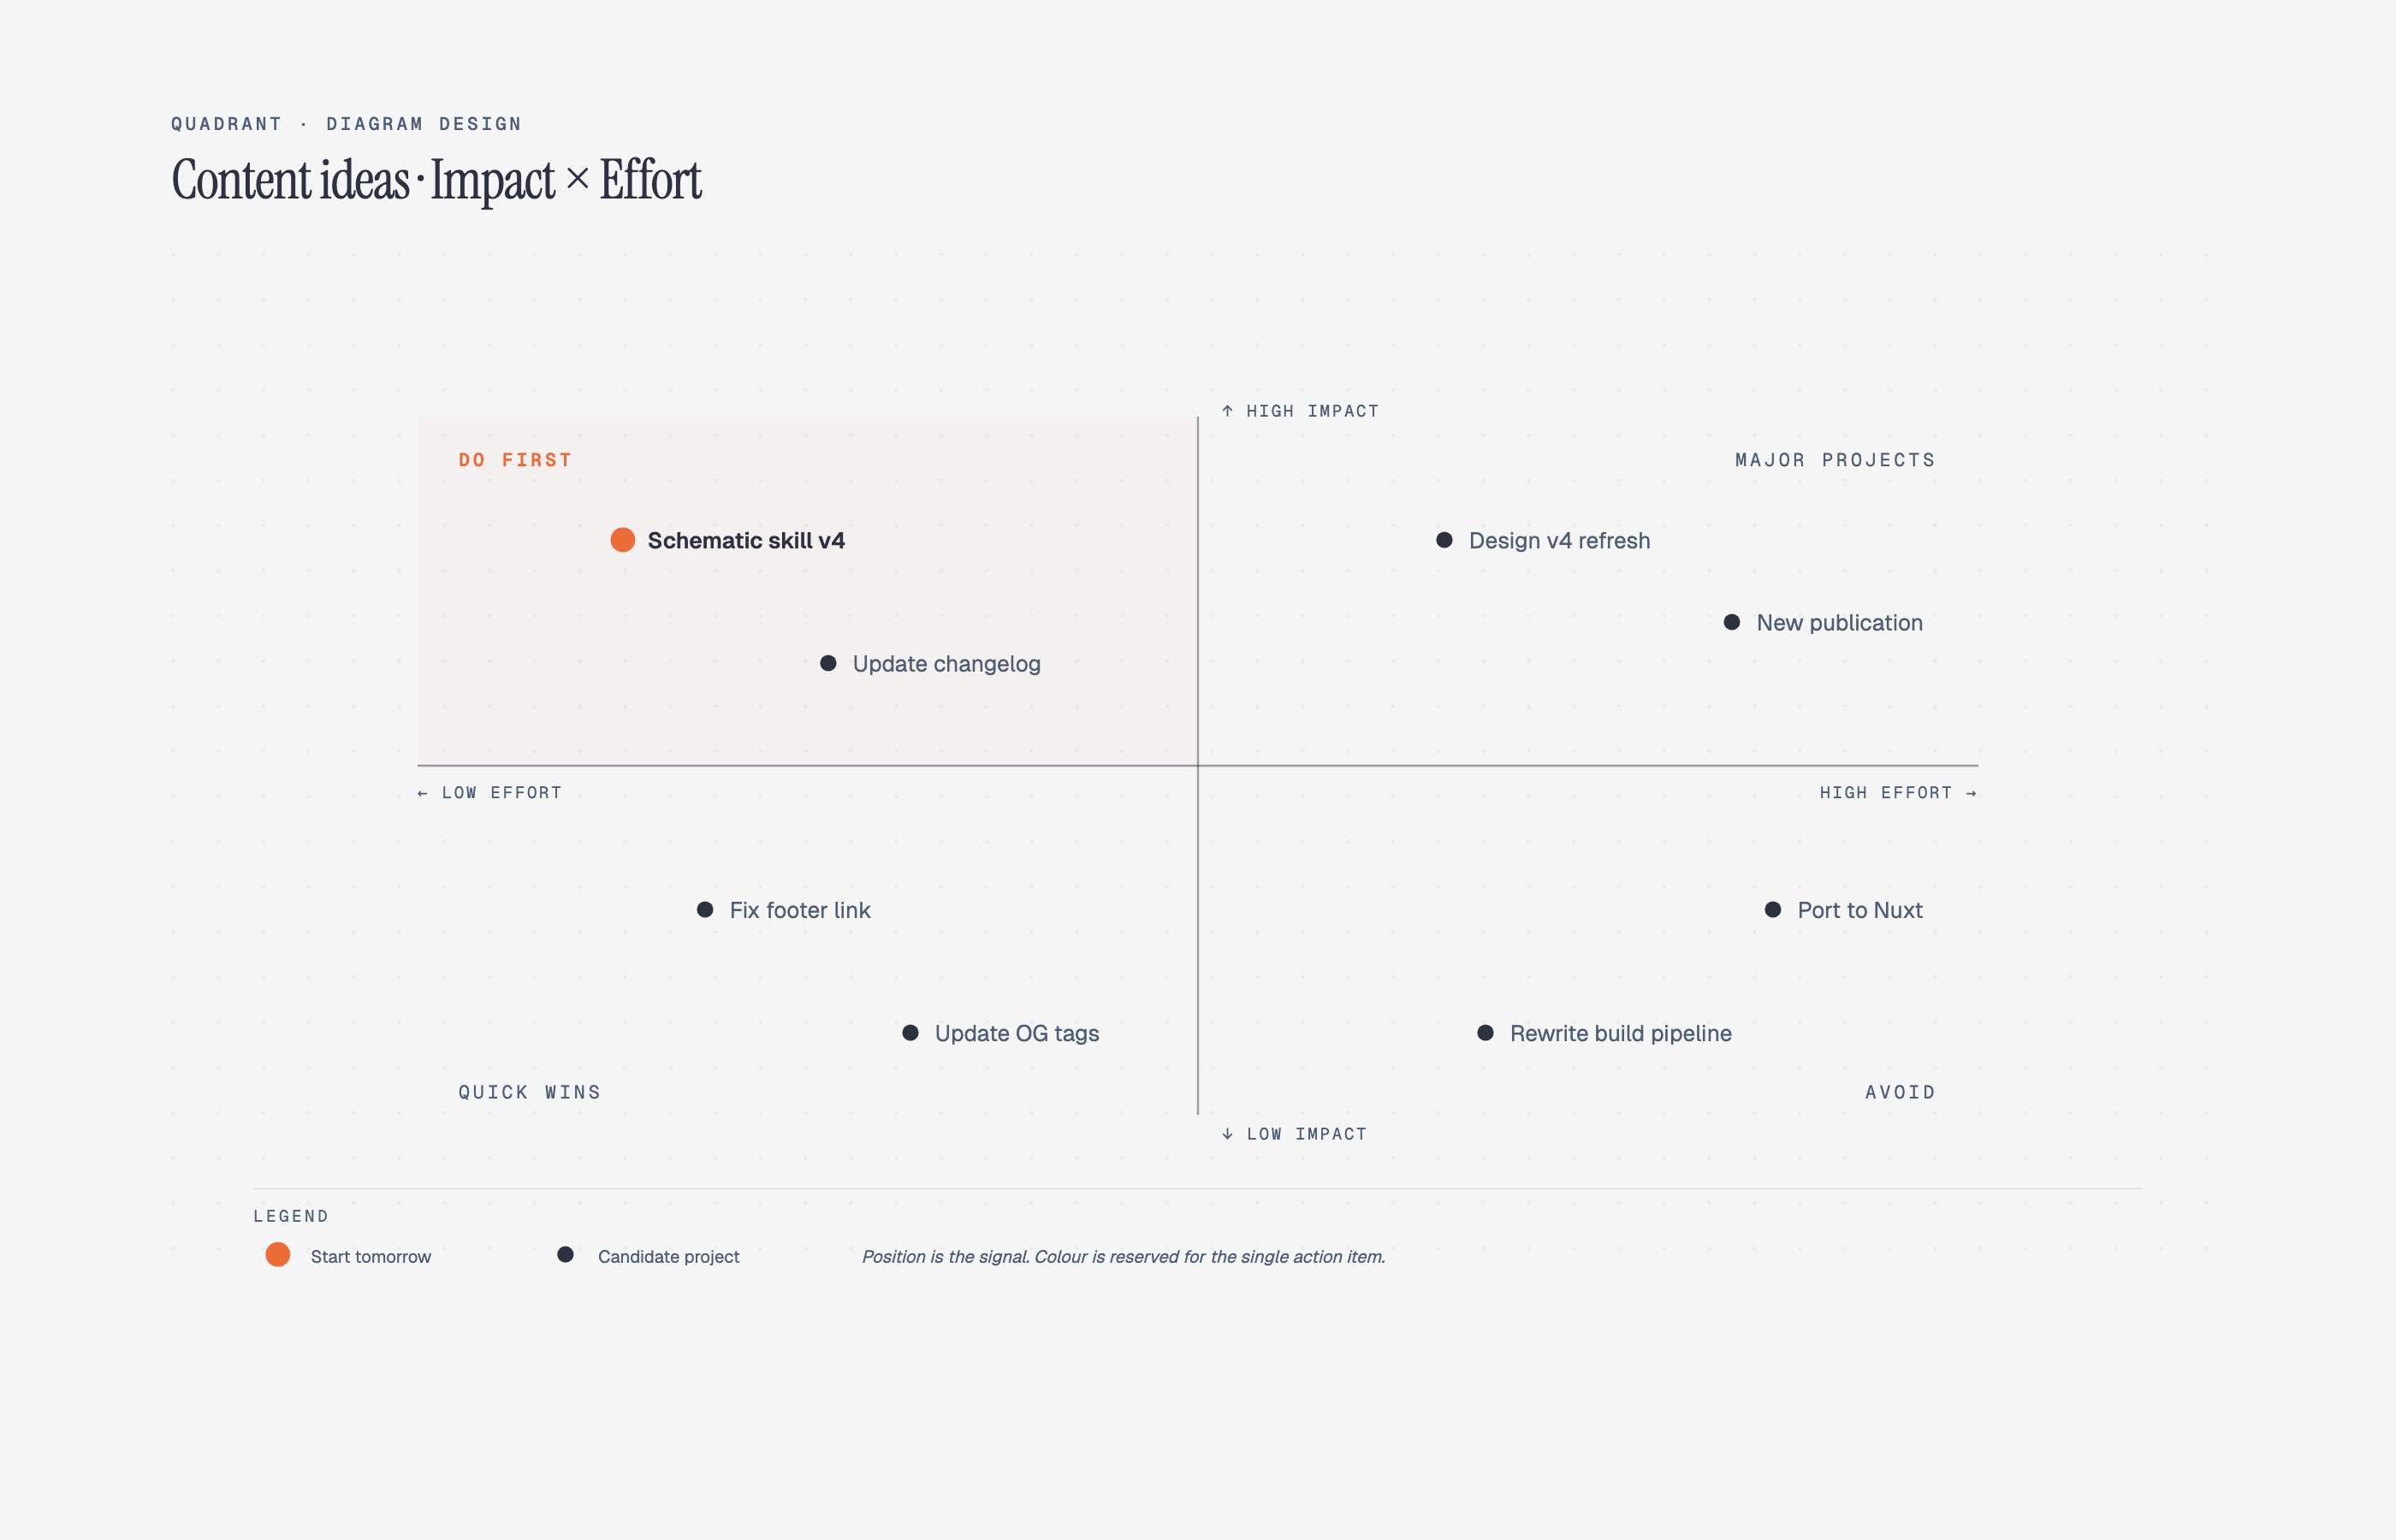 Quadrant Two-axis positioning |
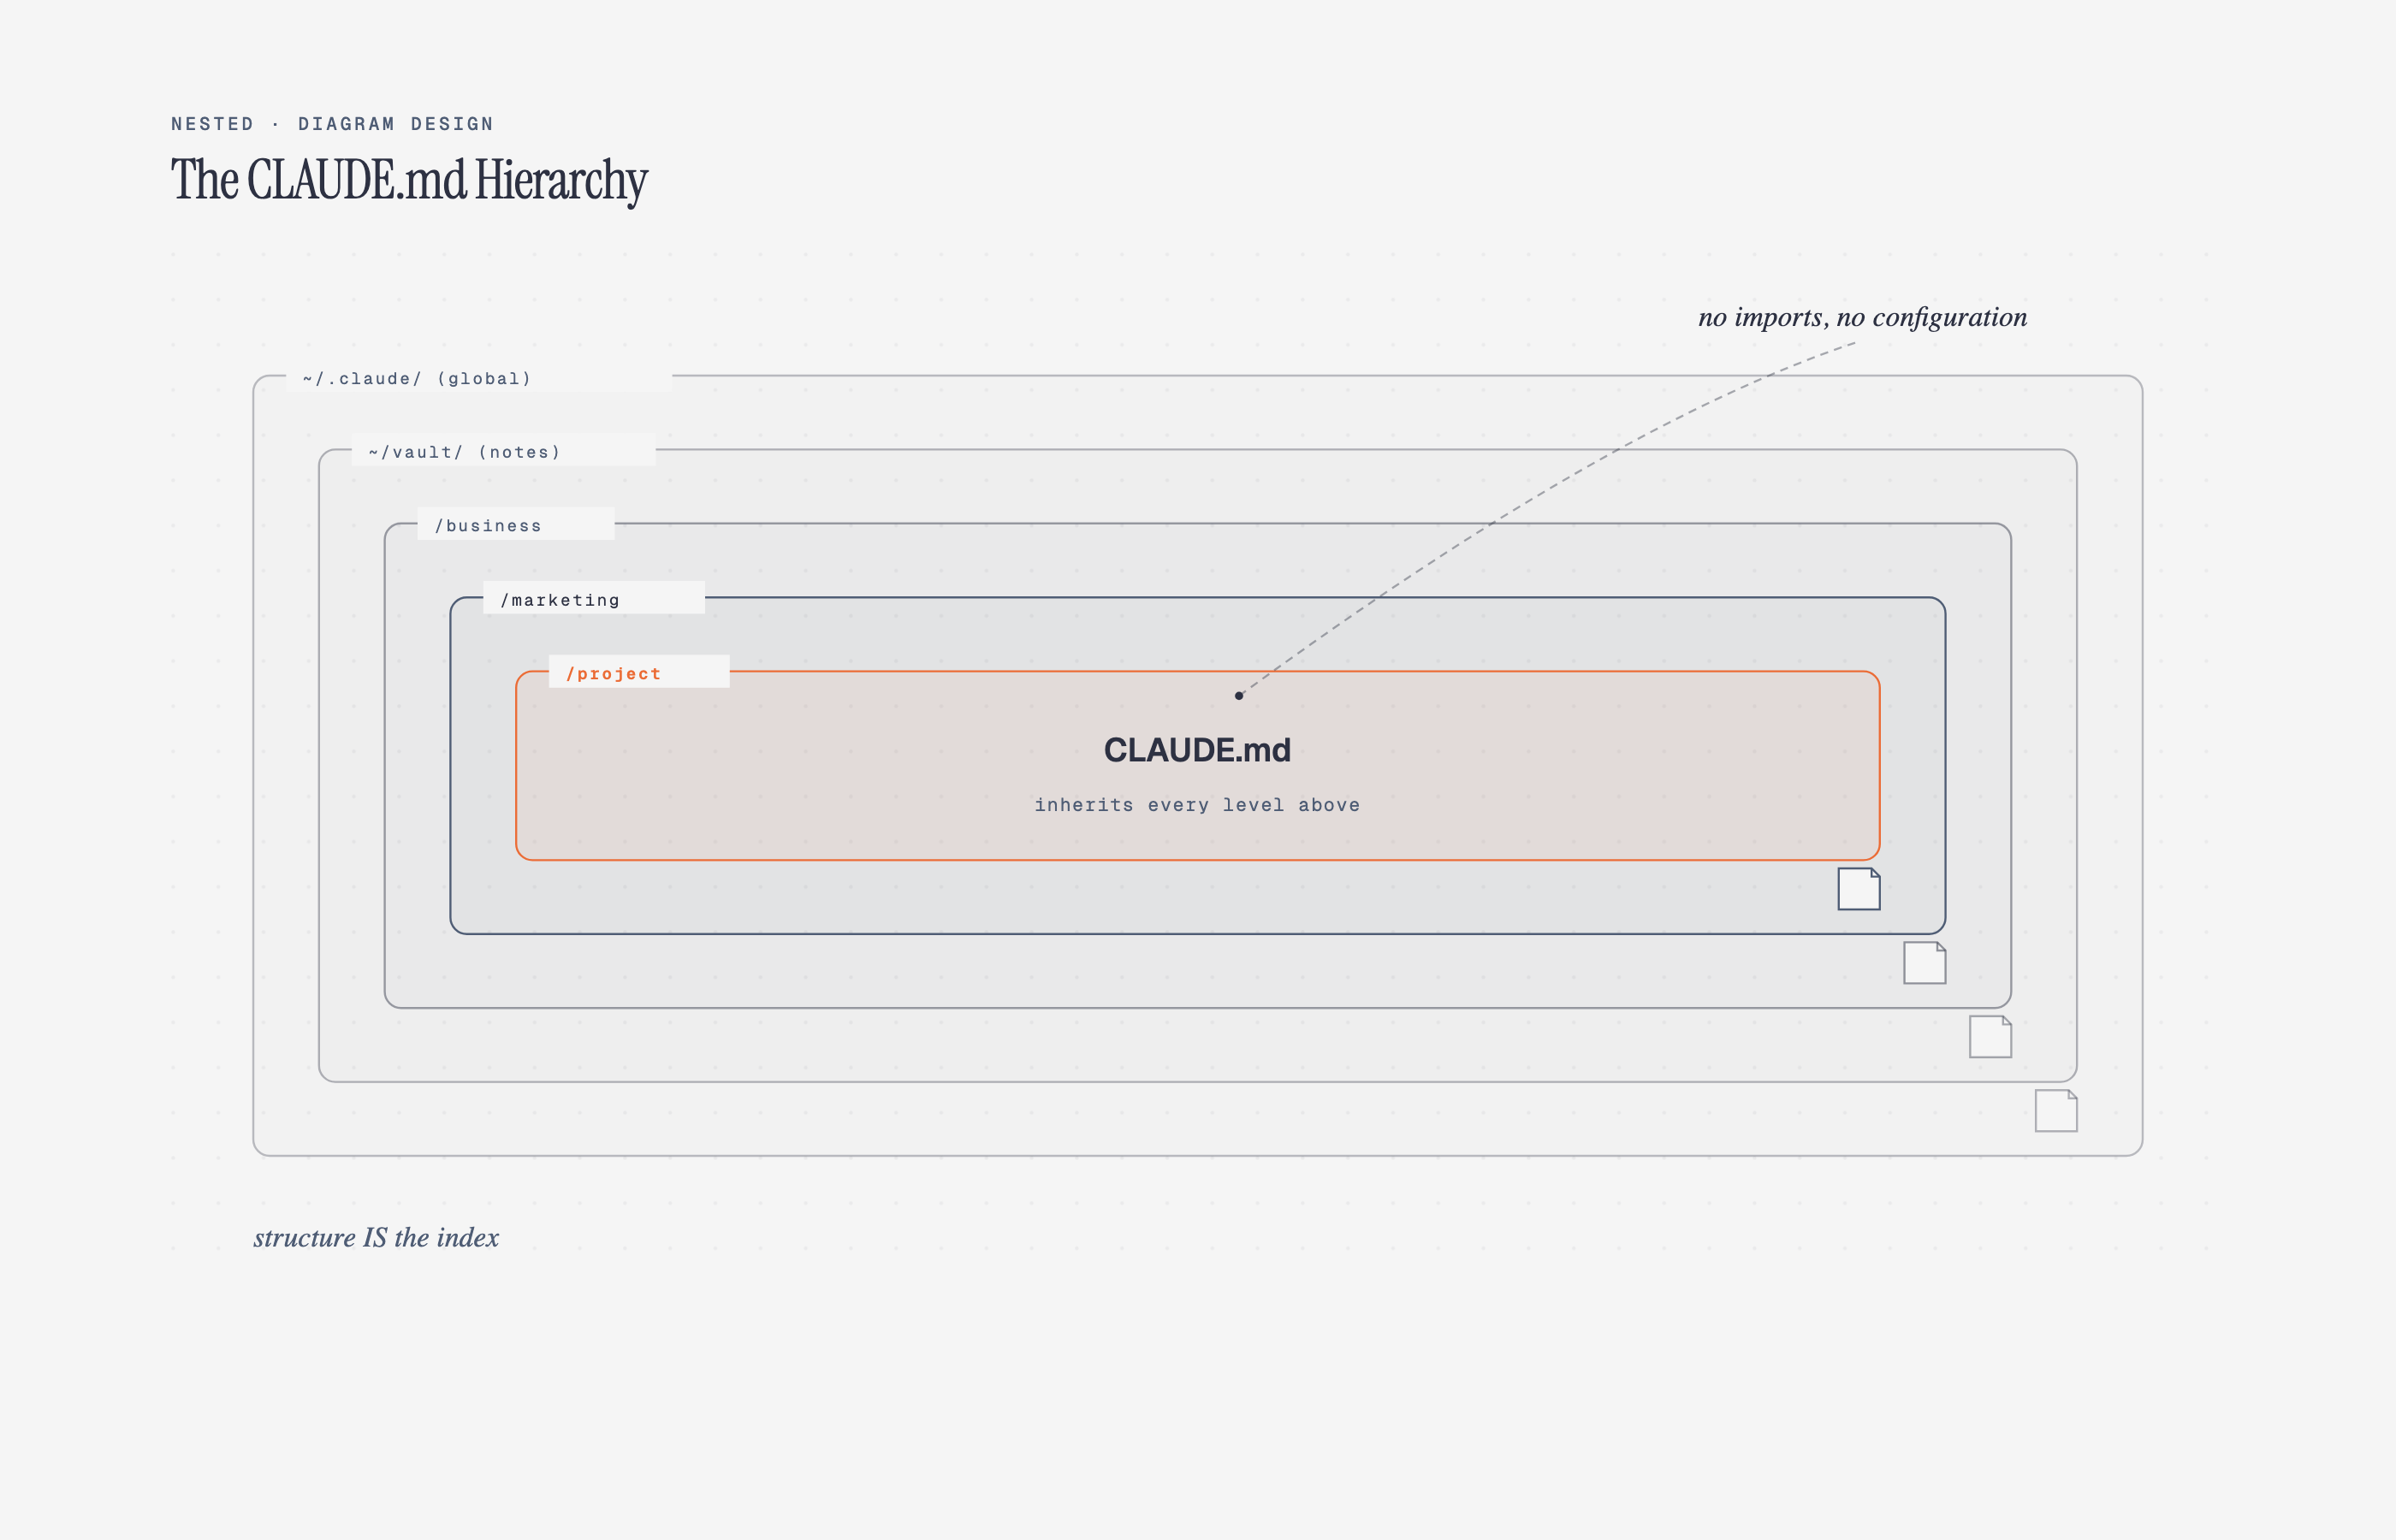 Nested Hierarchy by containment |
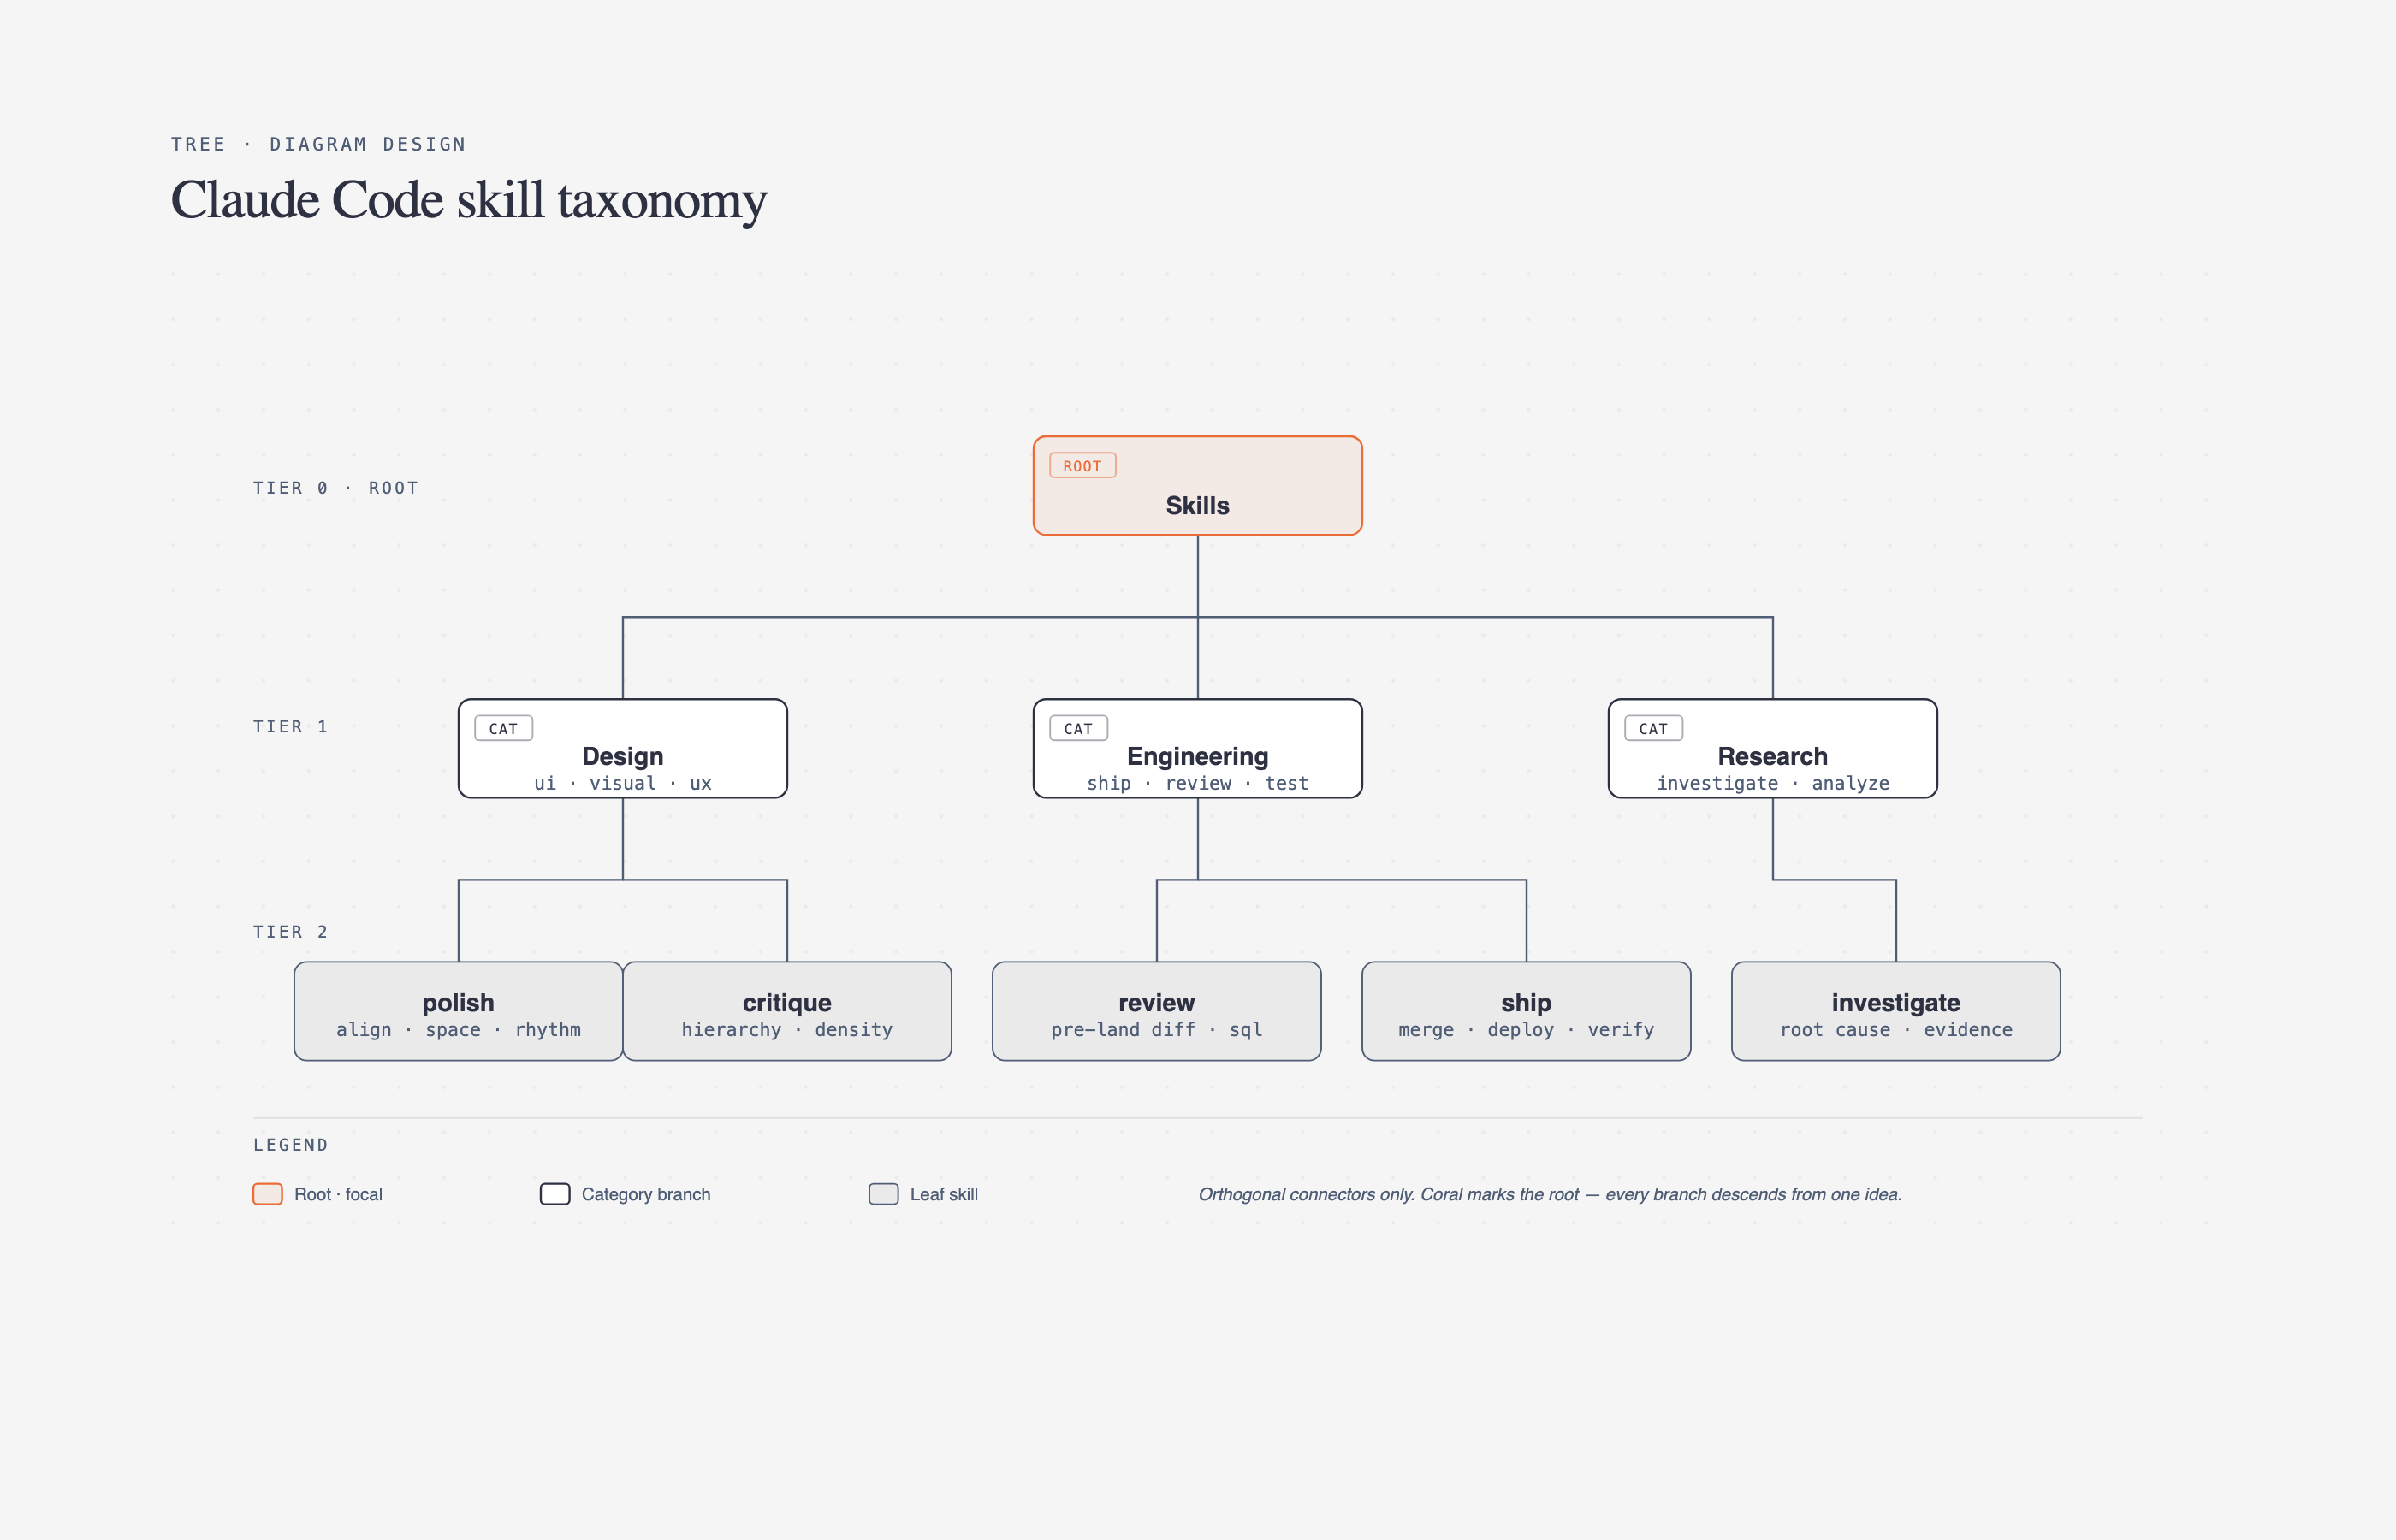 Tree Parent → children |
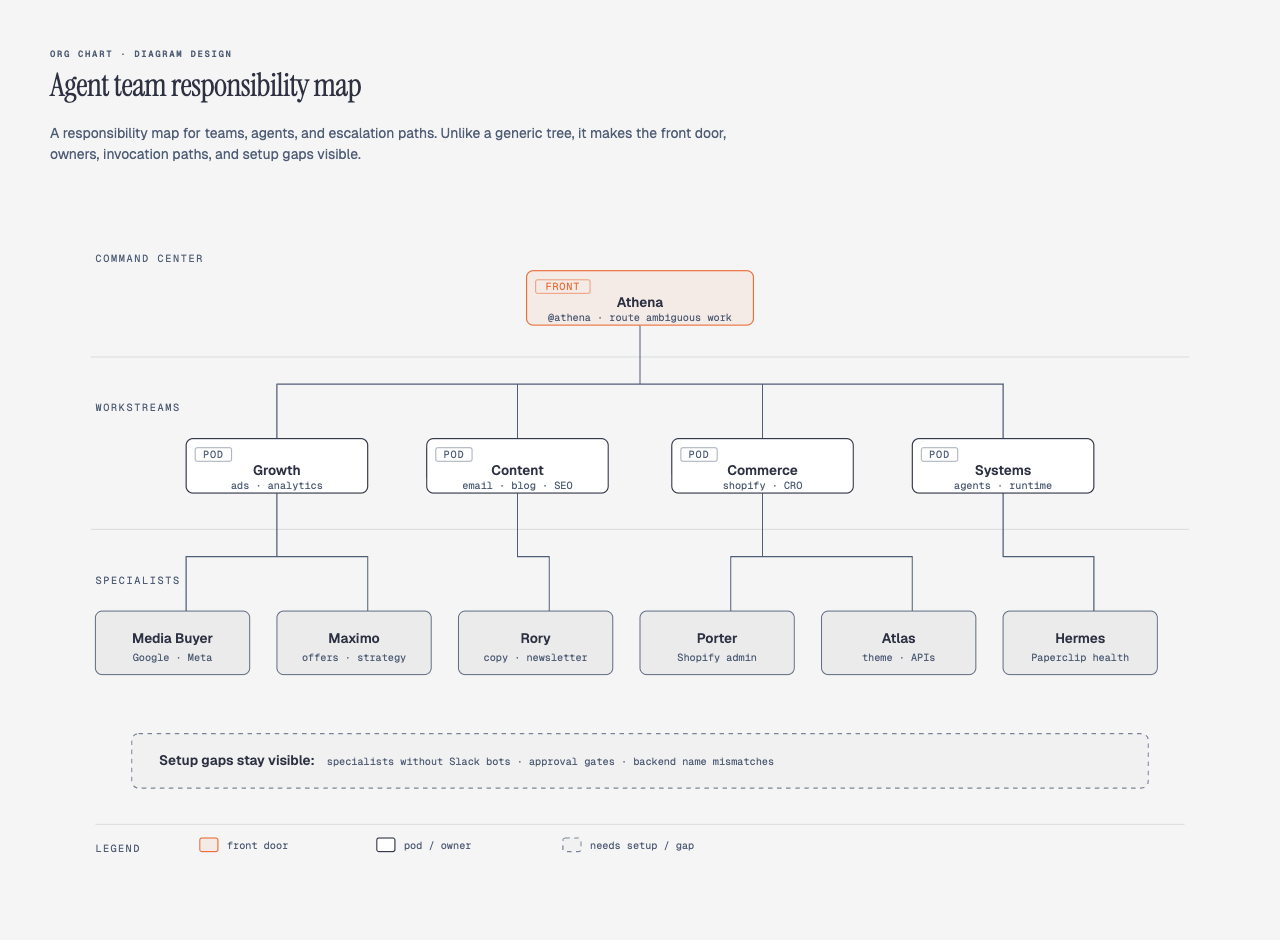 Org chart Ownership + routing |
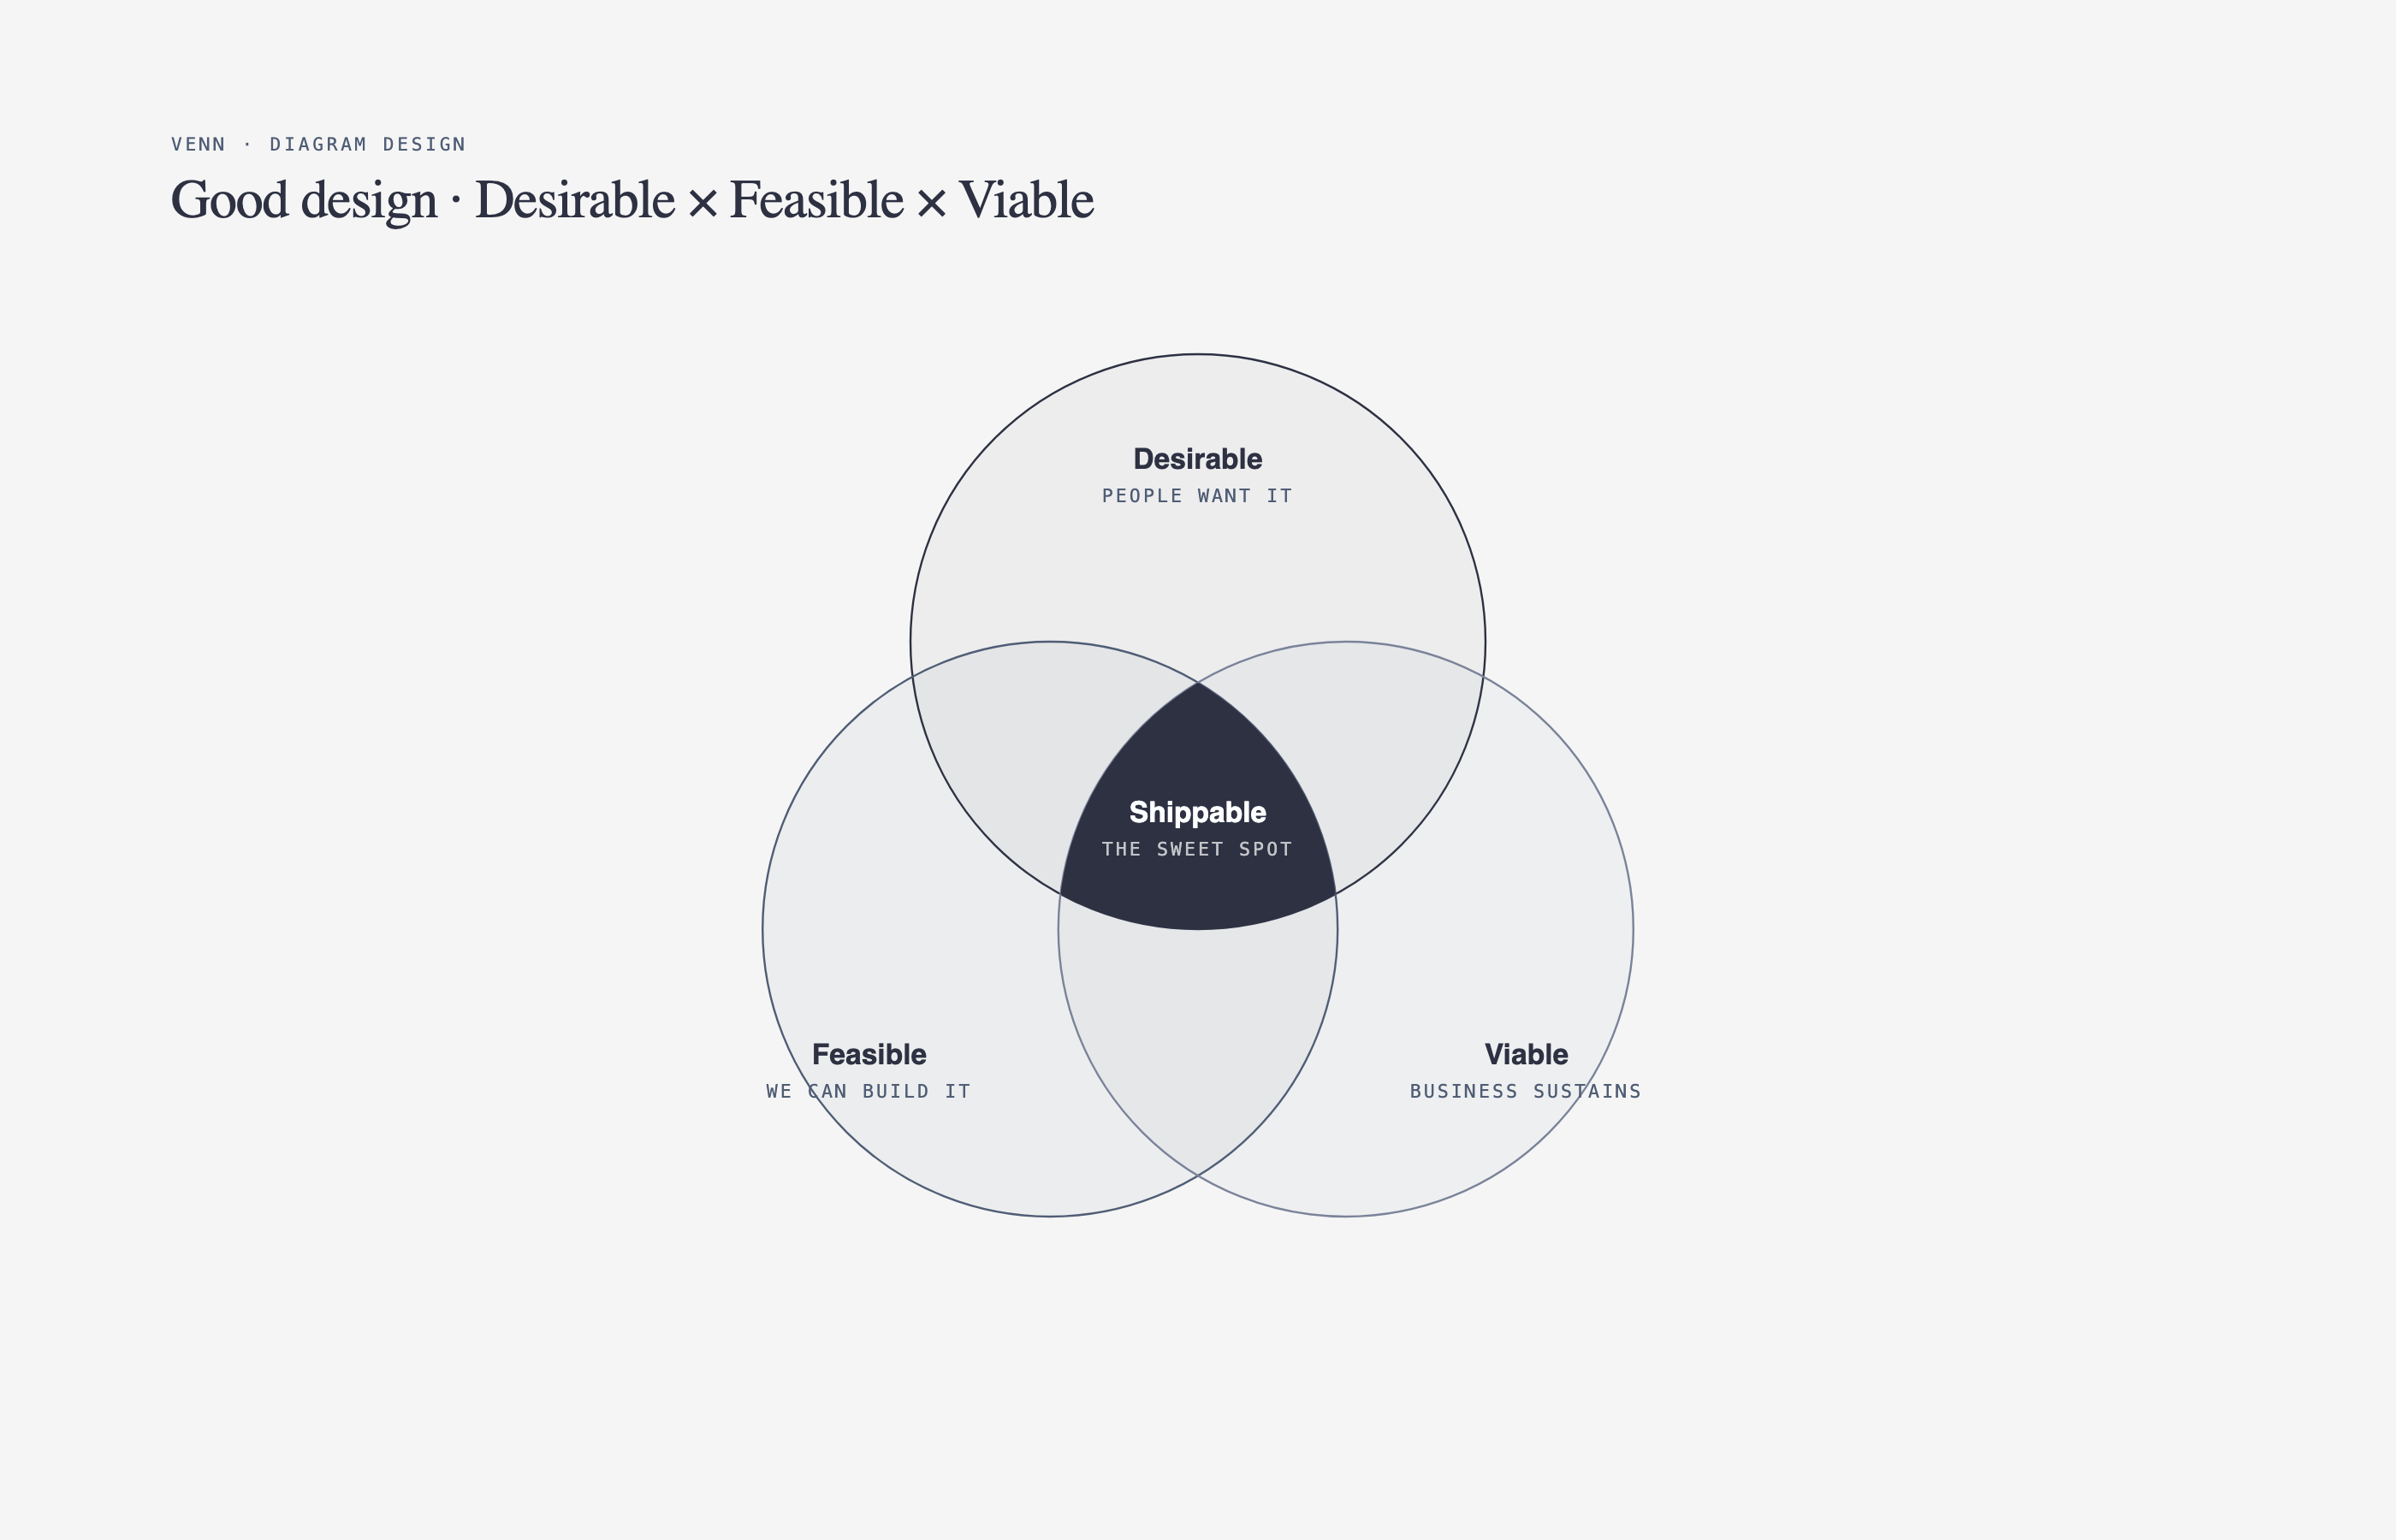 Venn Set overlap |
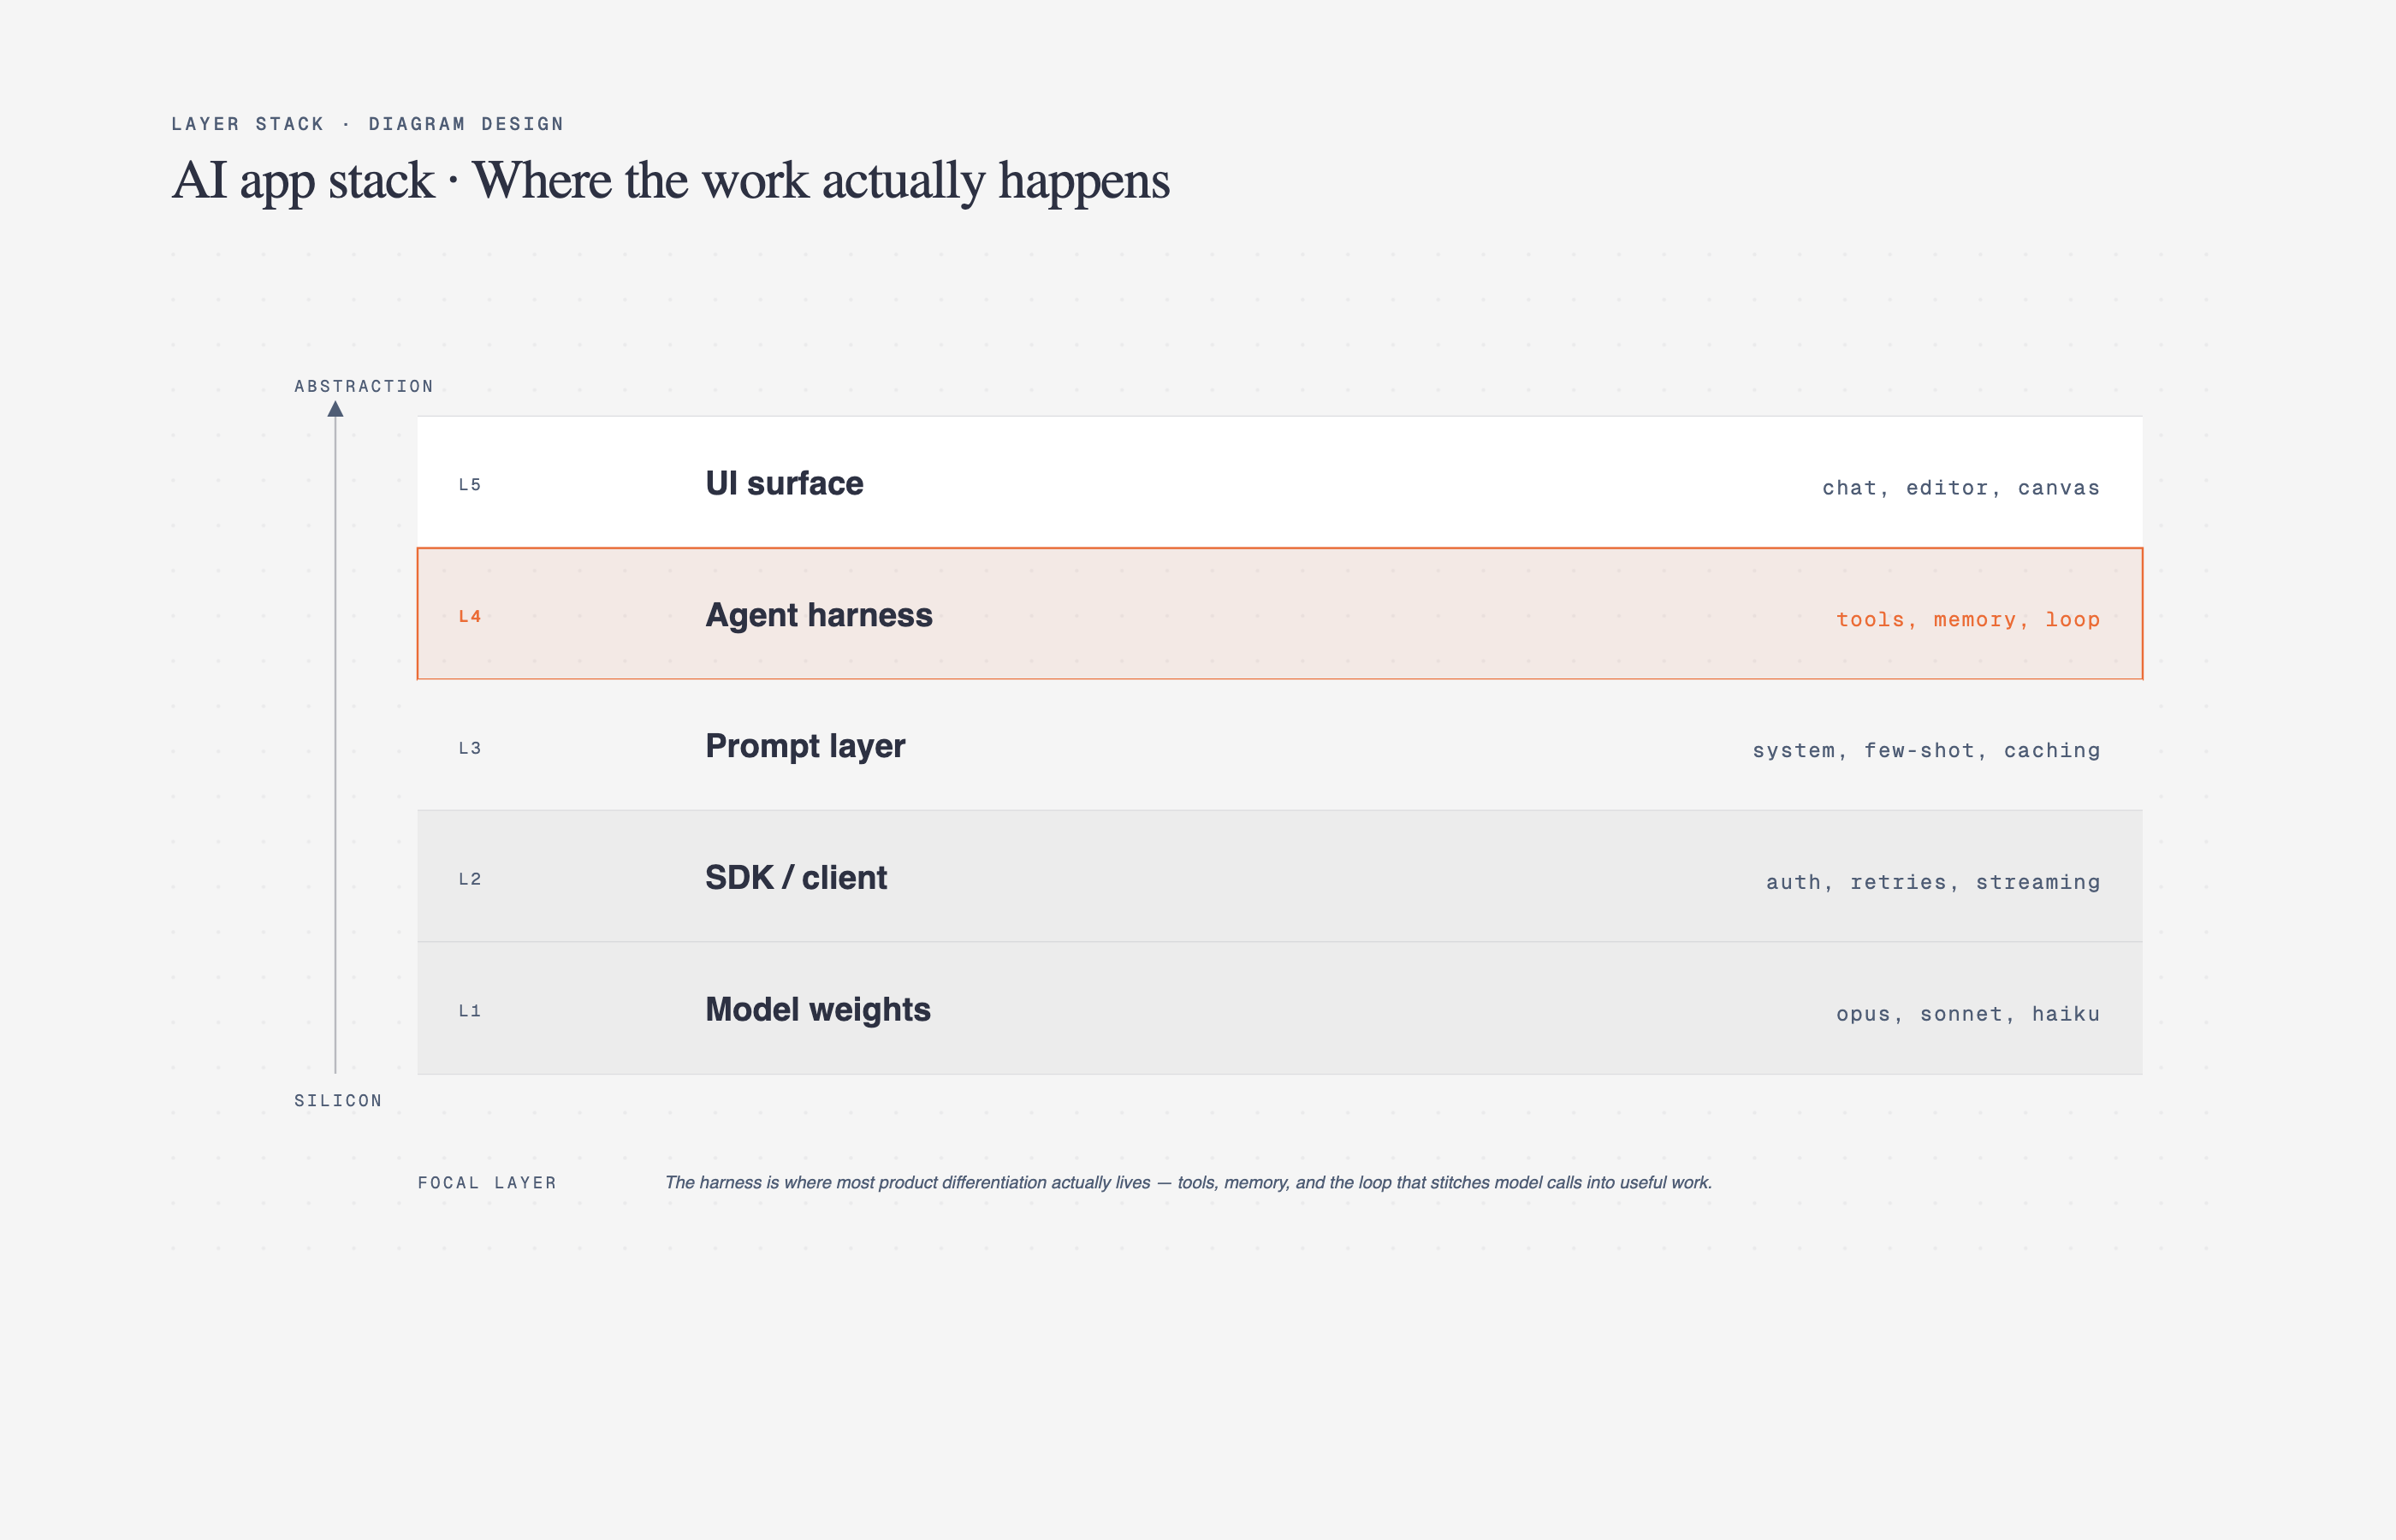 Layer stack Stacked abstractions |
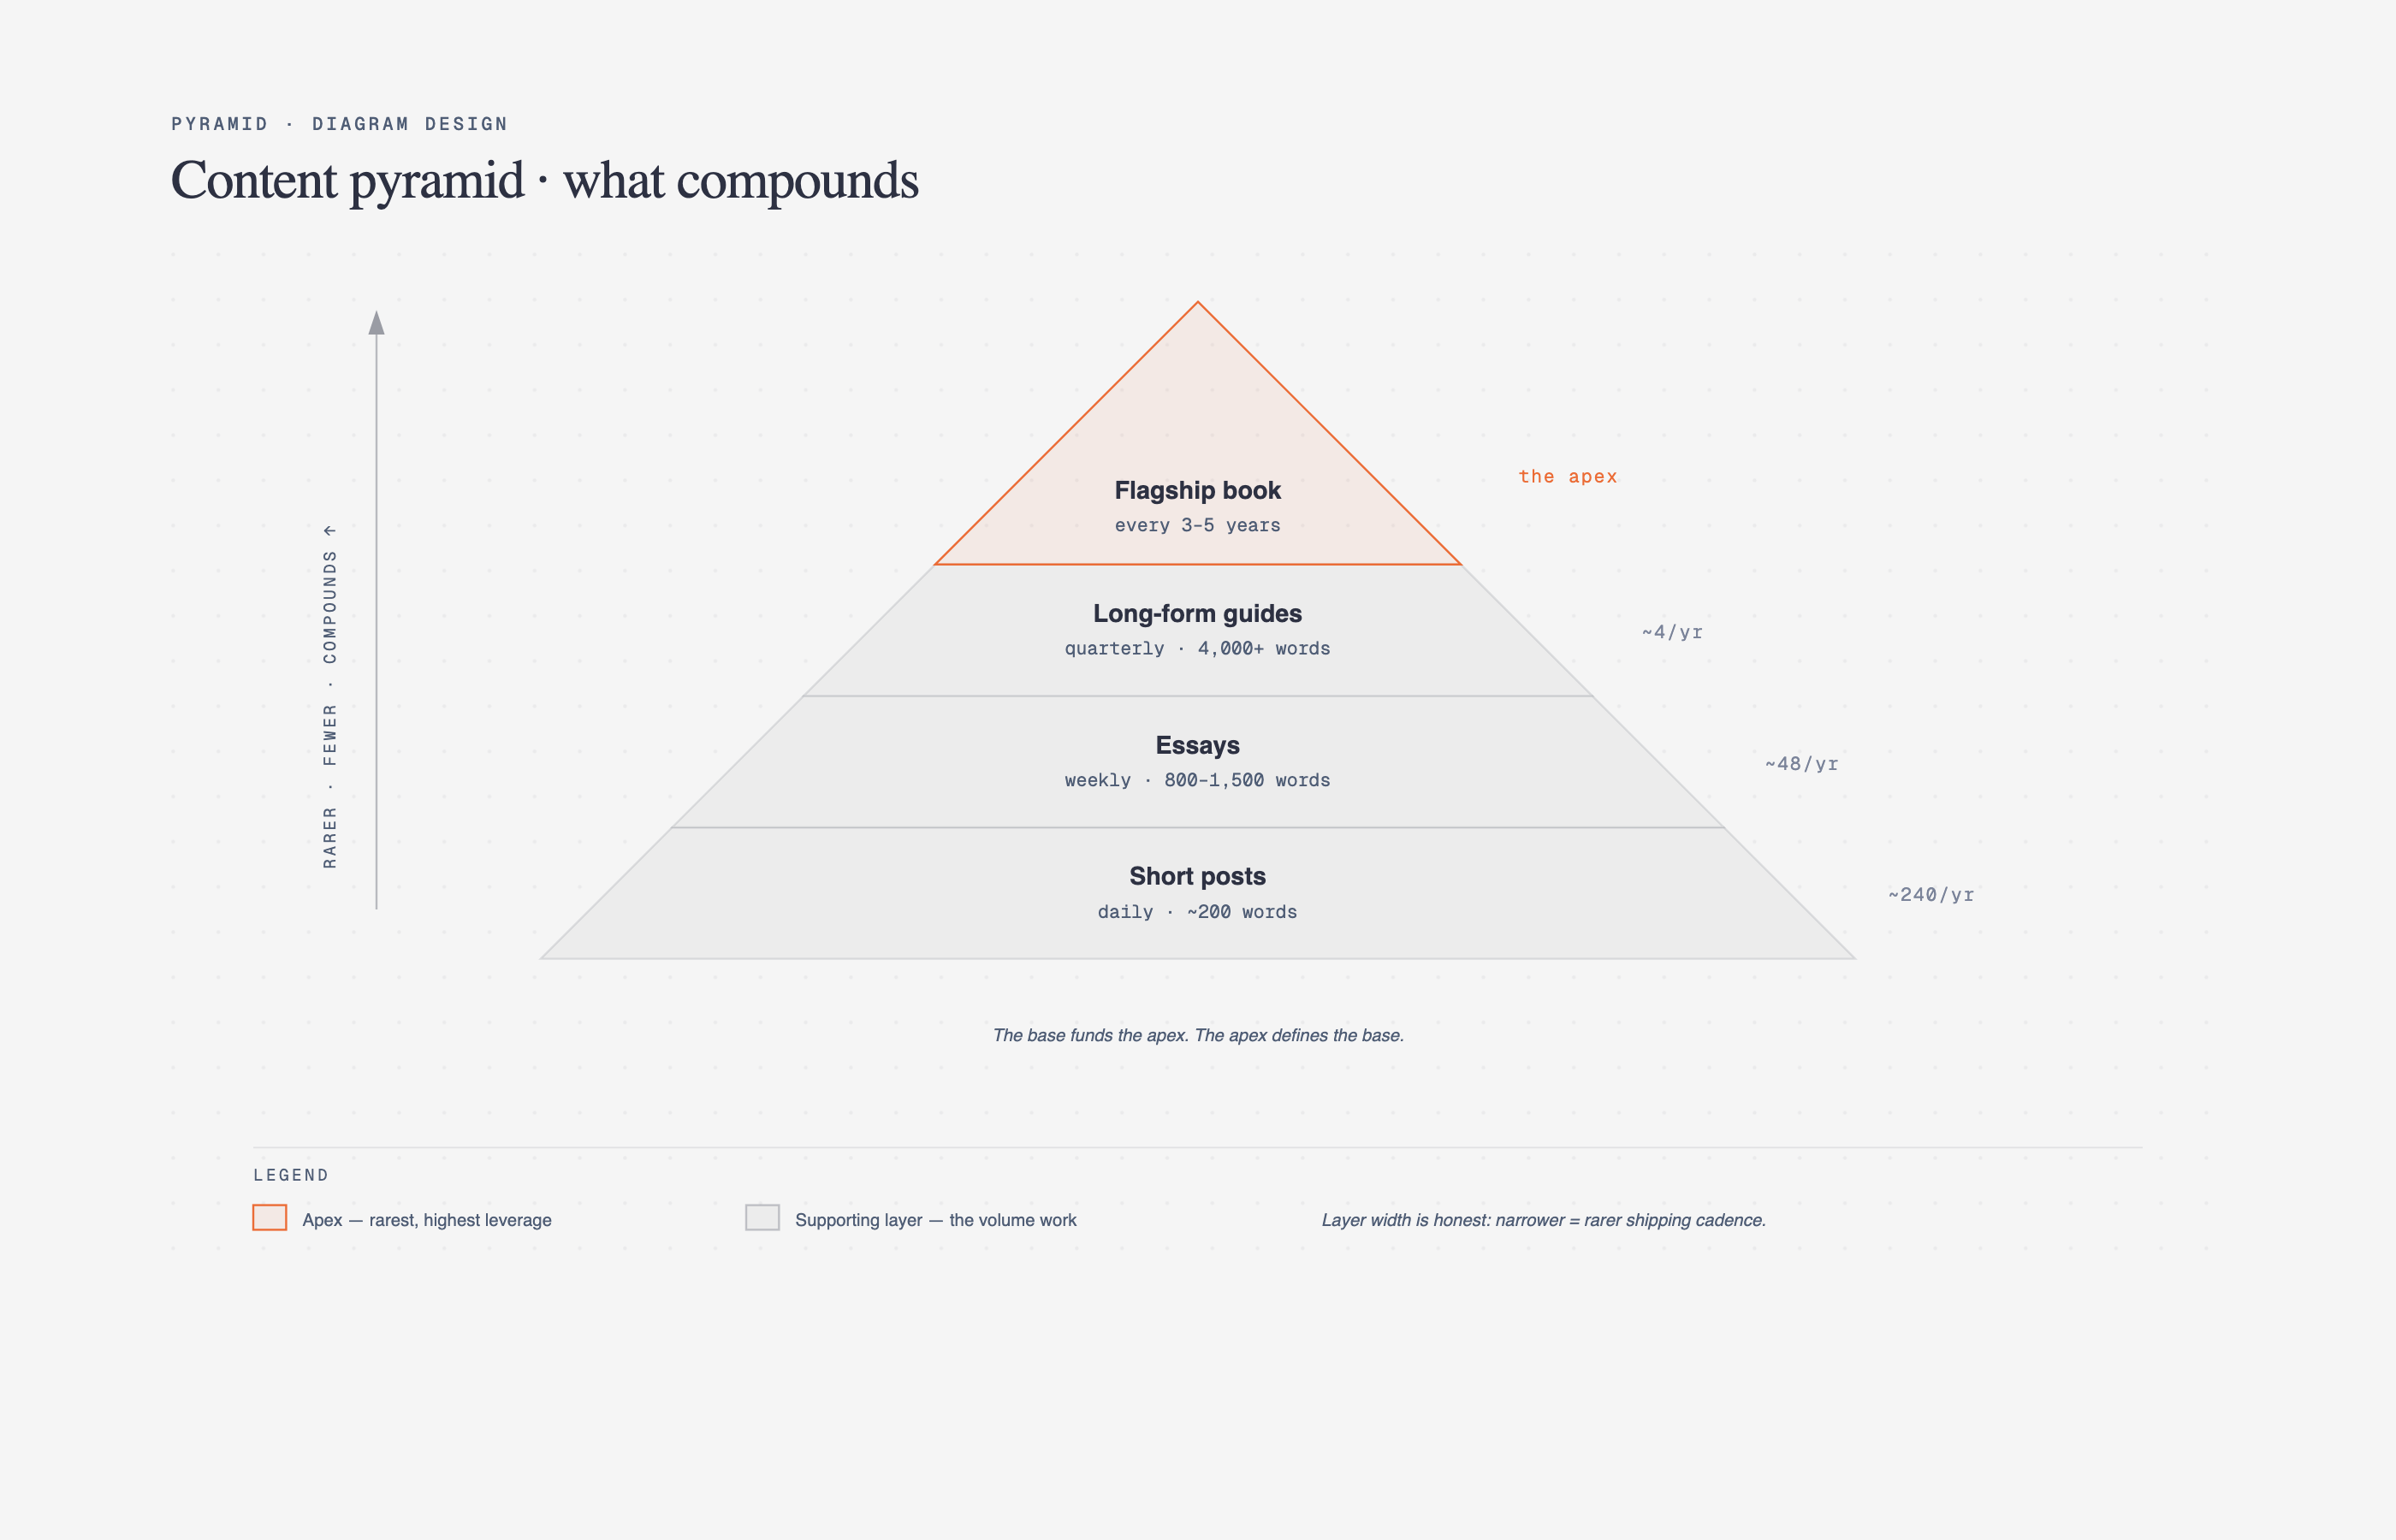 Pyramid / funnel Ranked hierarchy or drop-off |
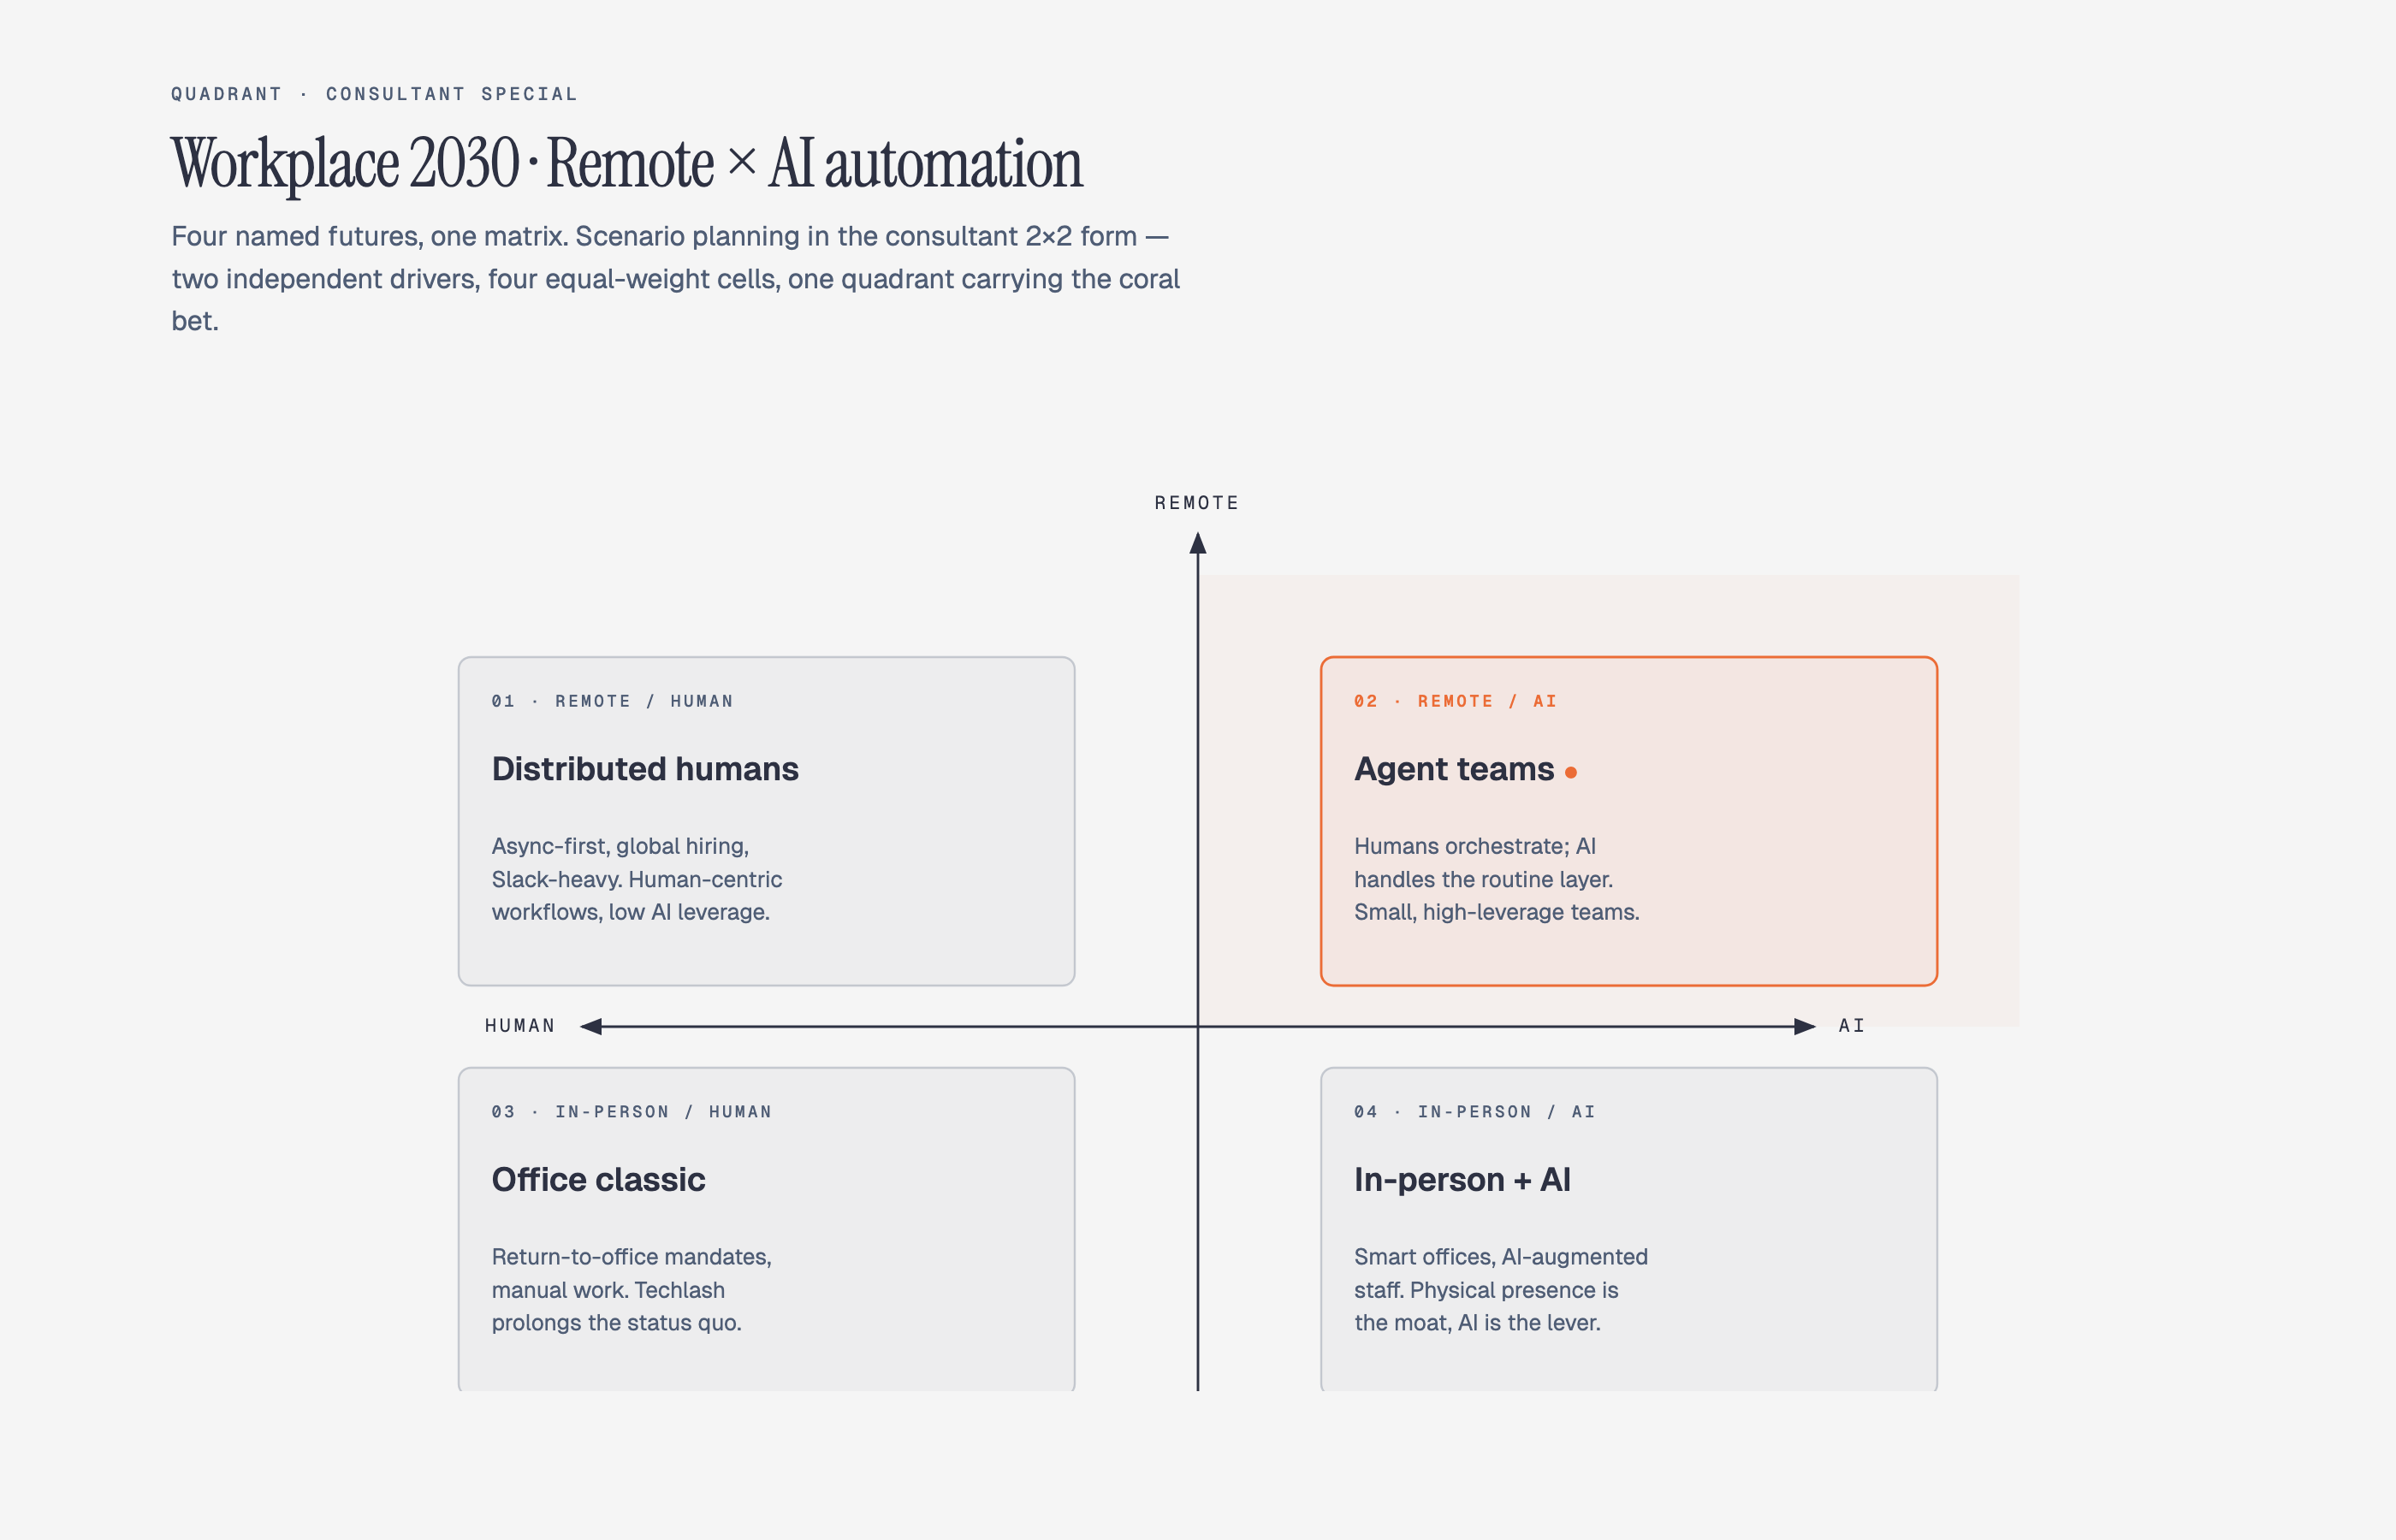 Consultant 2×2 Scenario matrix · named cells |
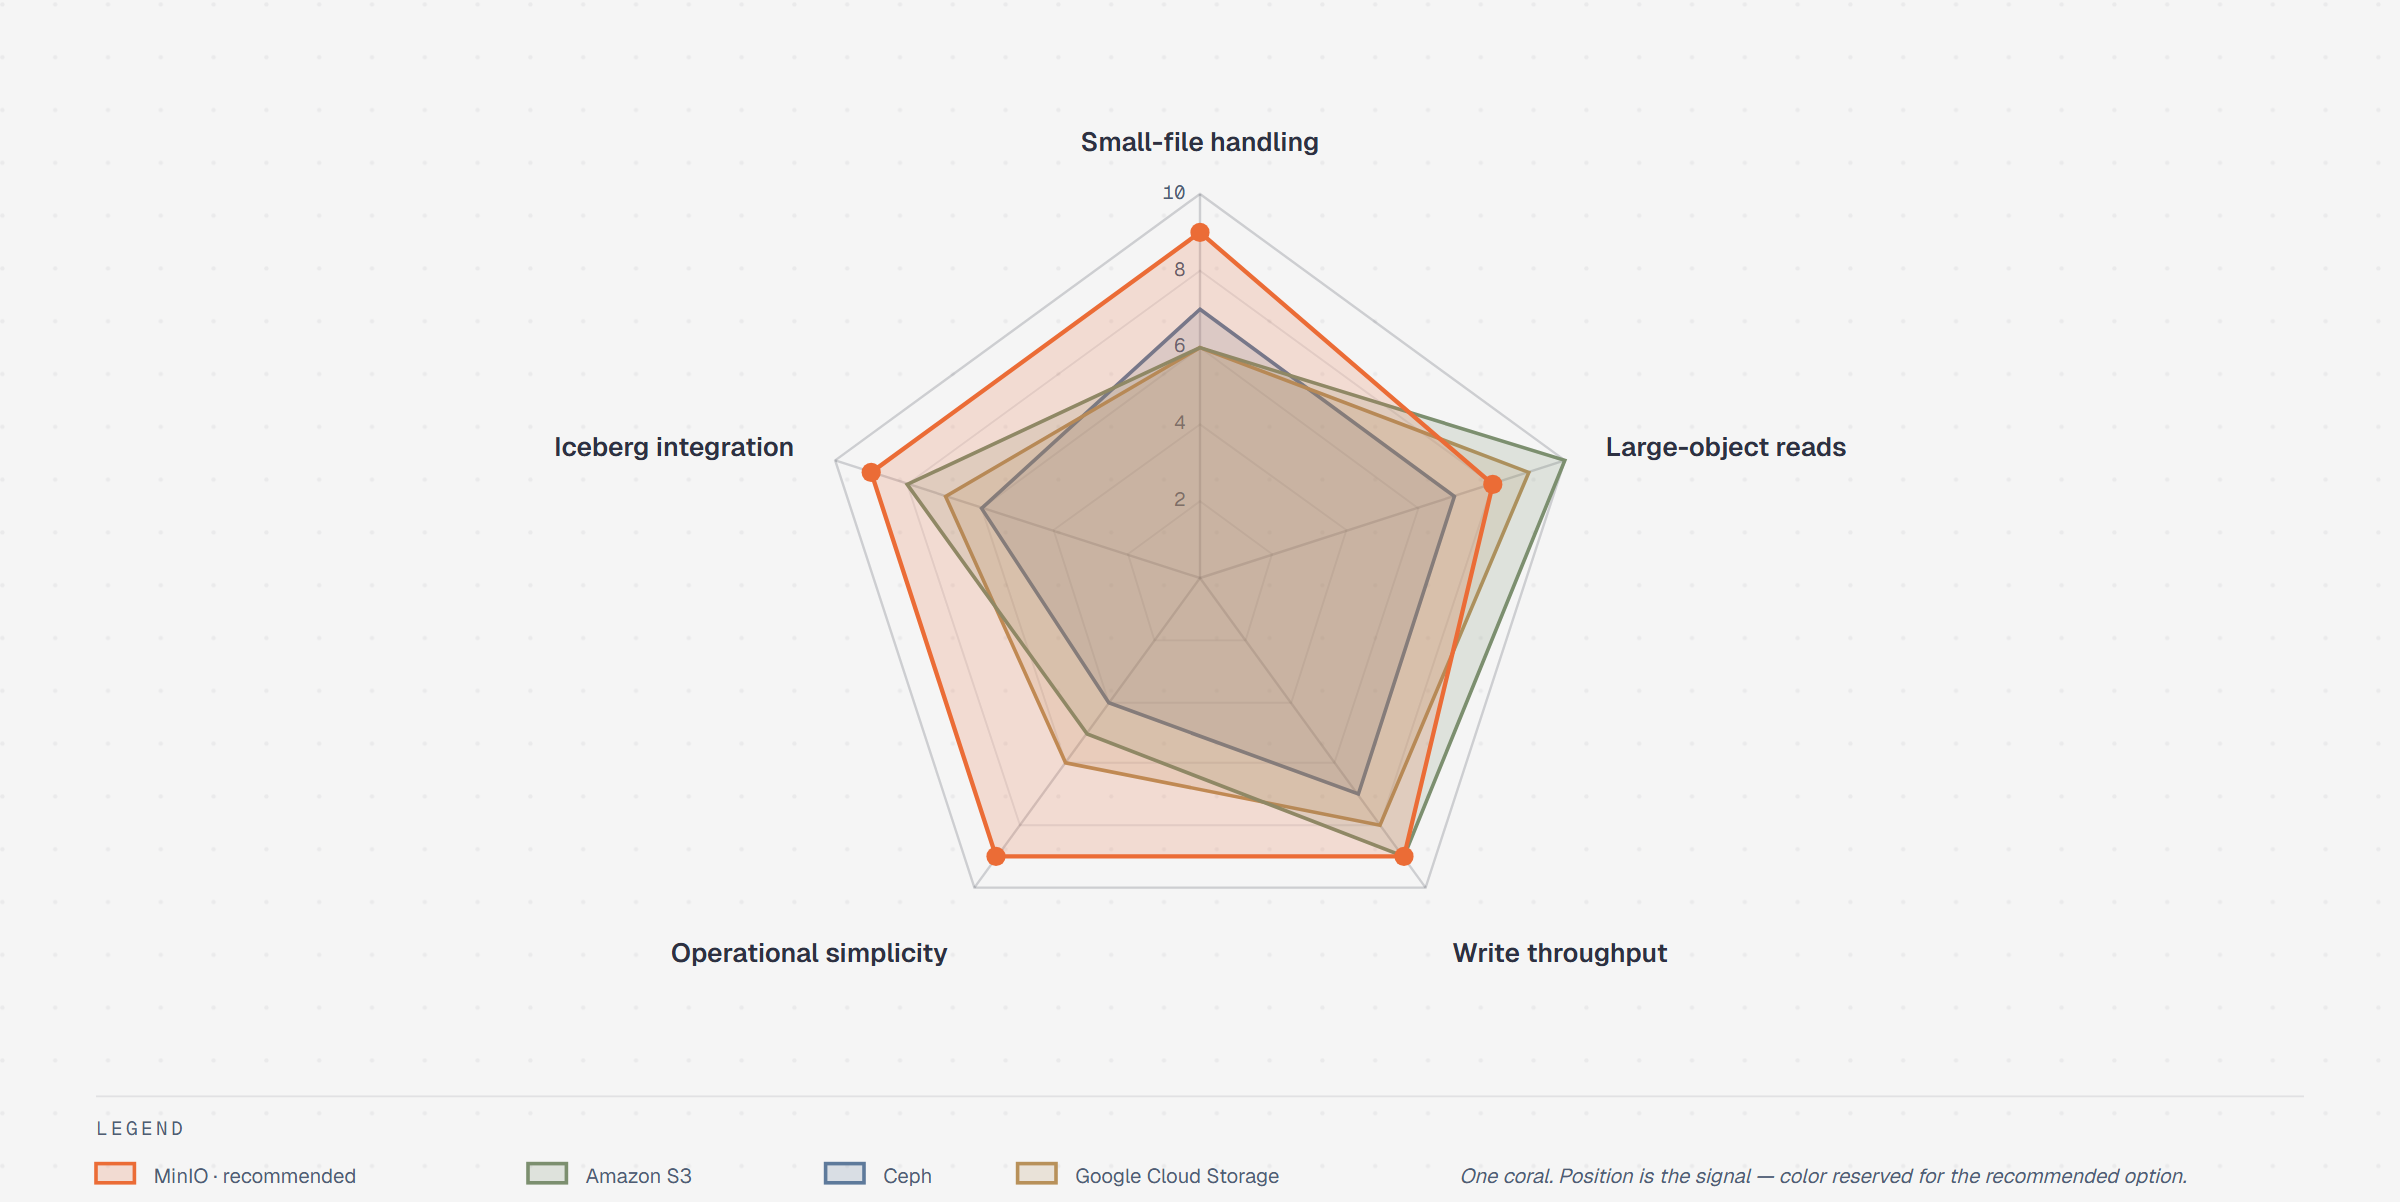 Radar / Spider Multi-axis comparison |
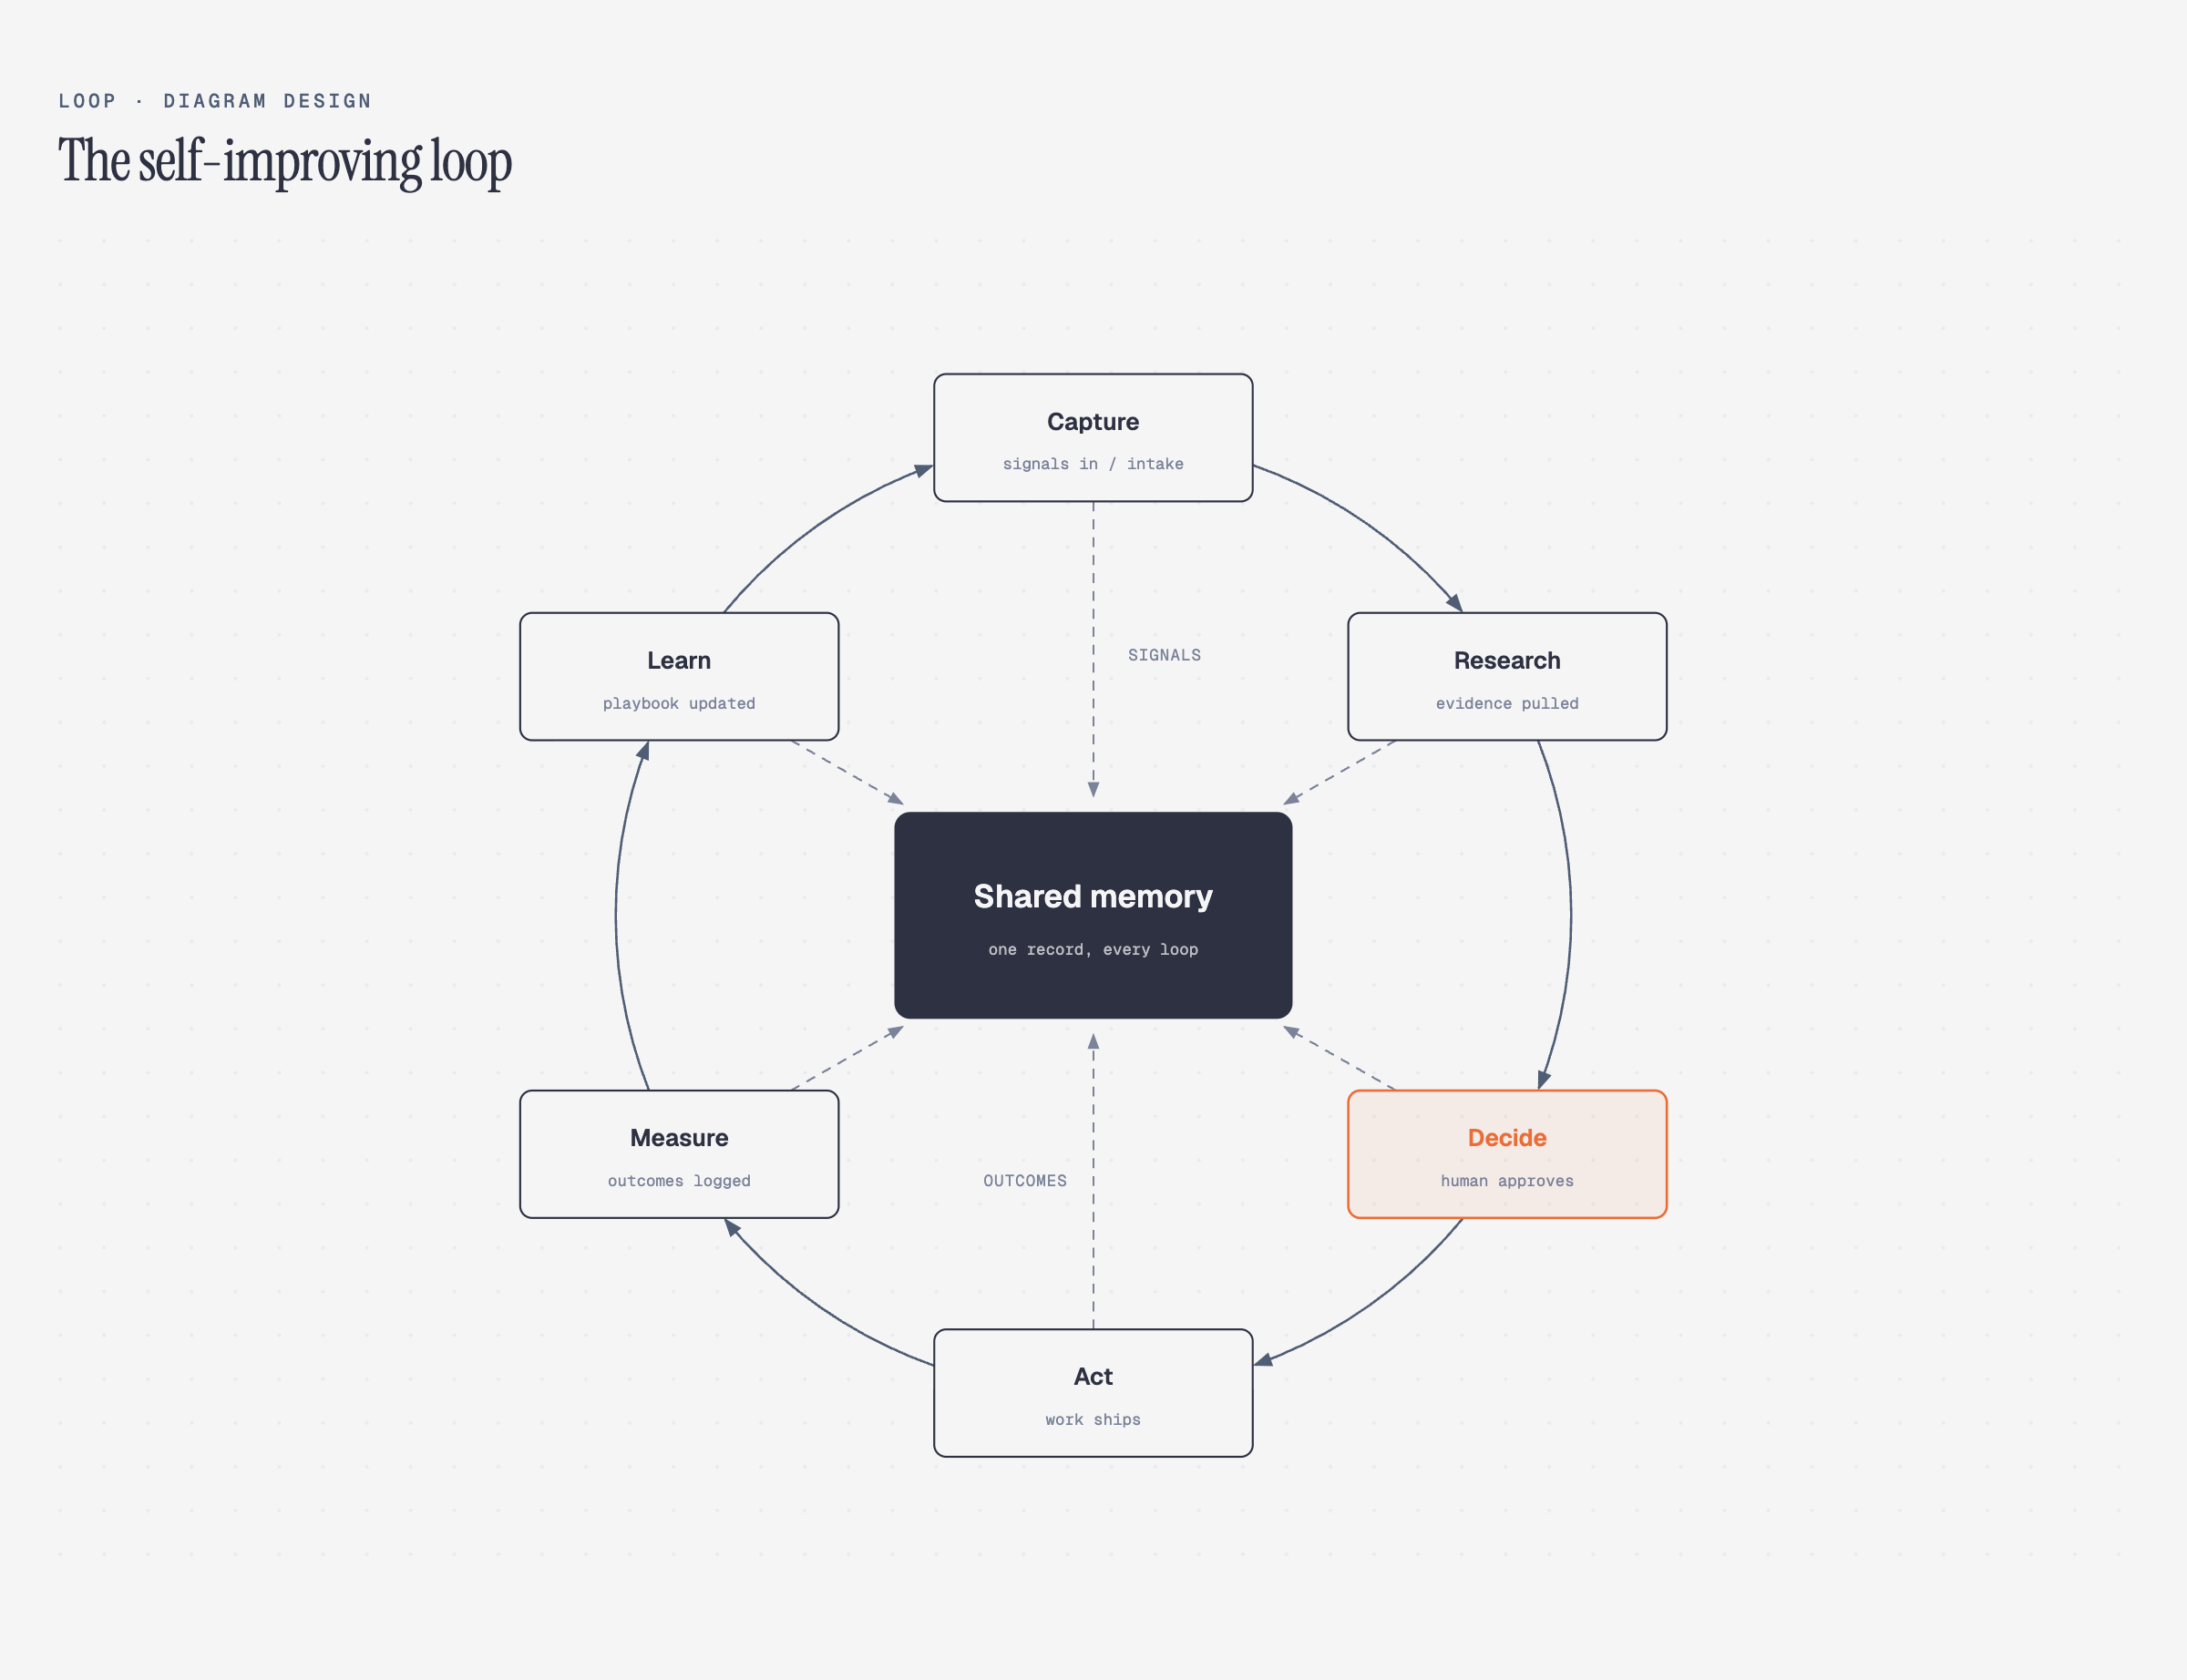 Loop Flywheel · stations around a hub |
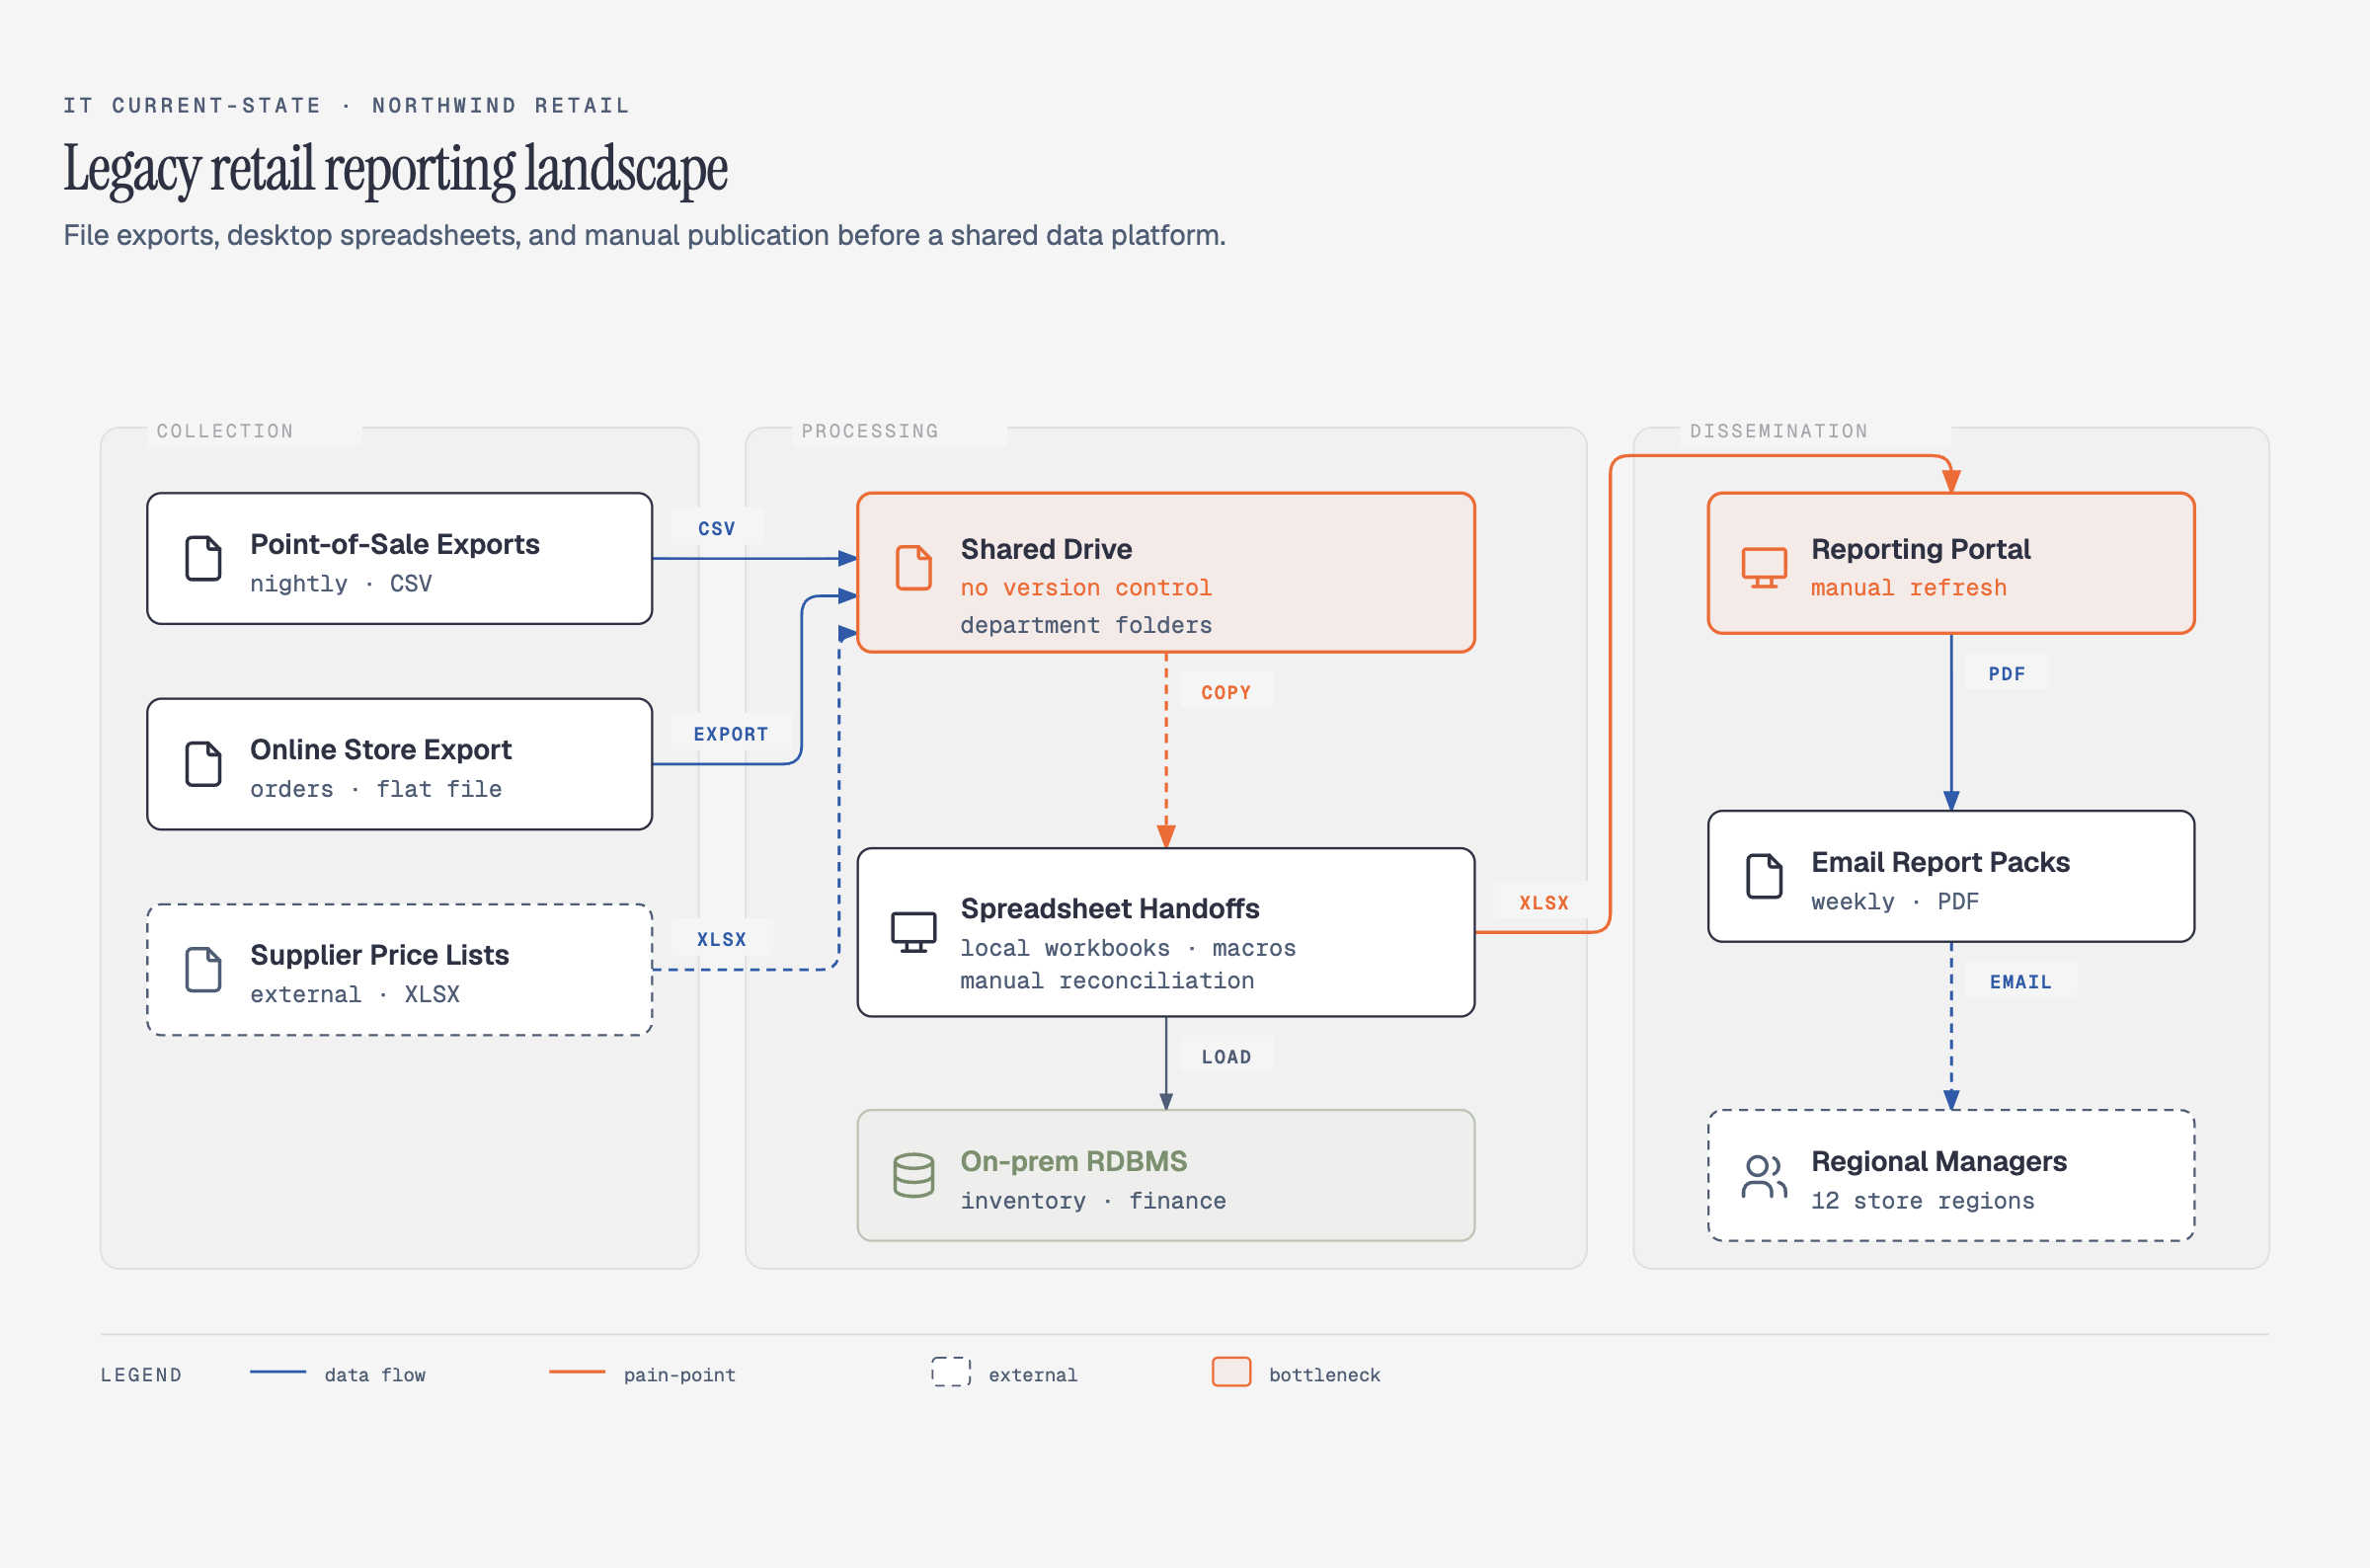 IT current-state Legacy landscape · modernization |
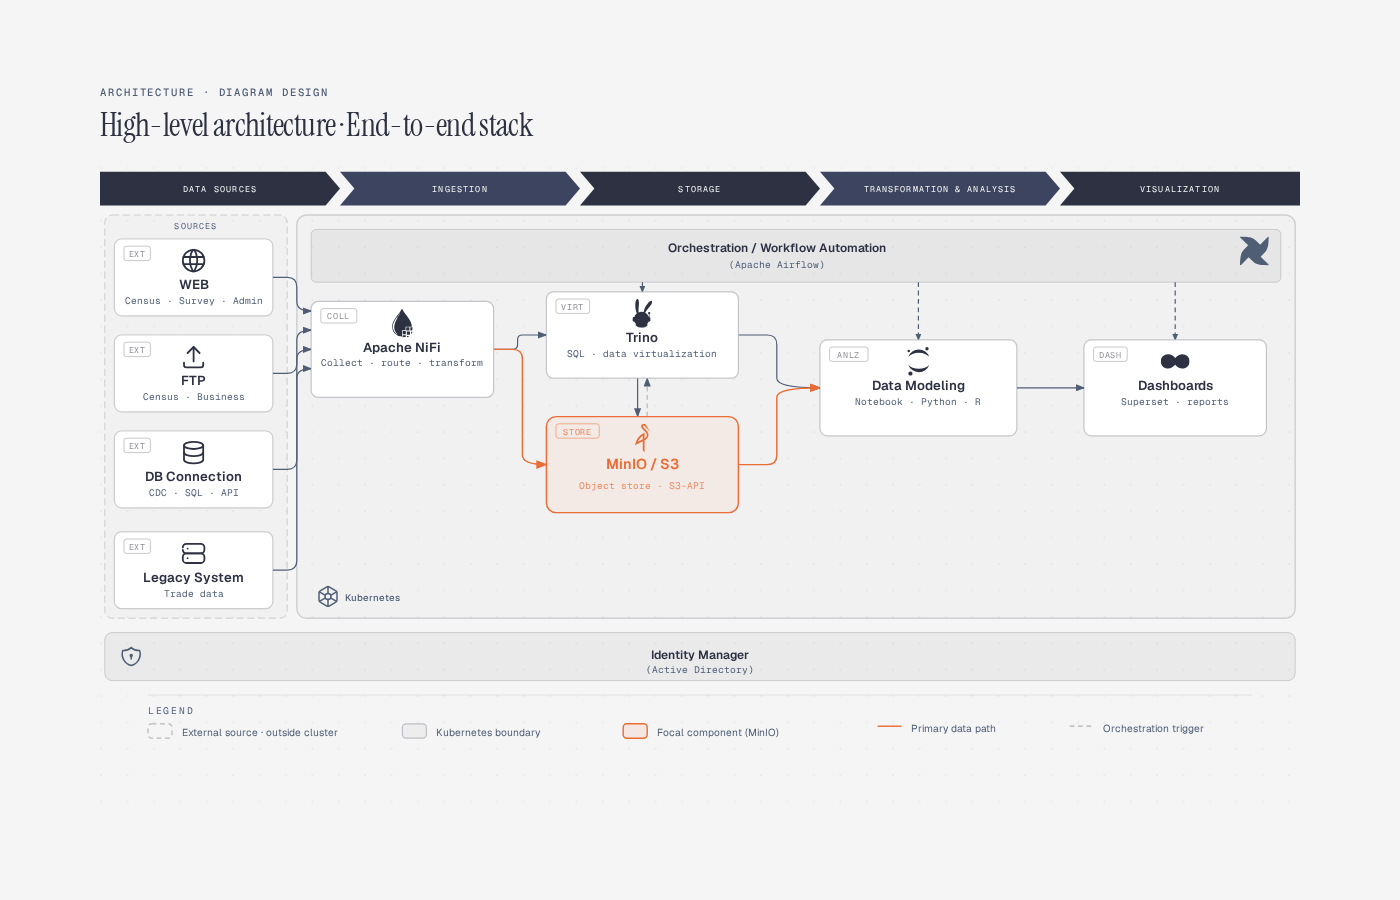 High-Level End-to-end stack on a cluster |
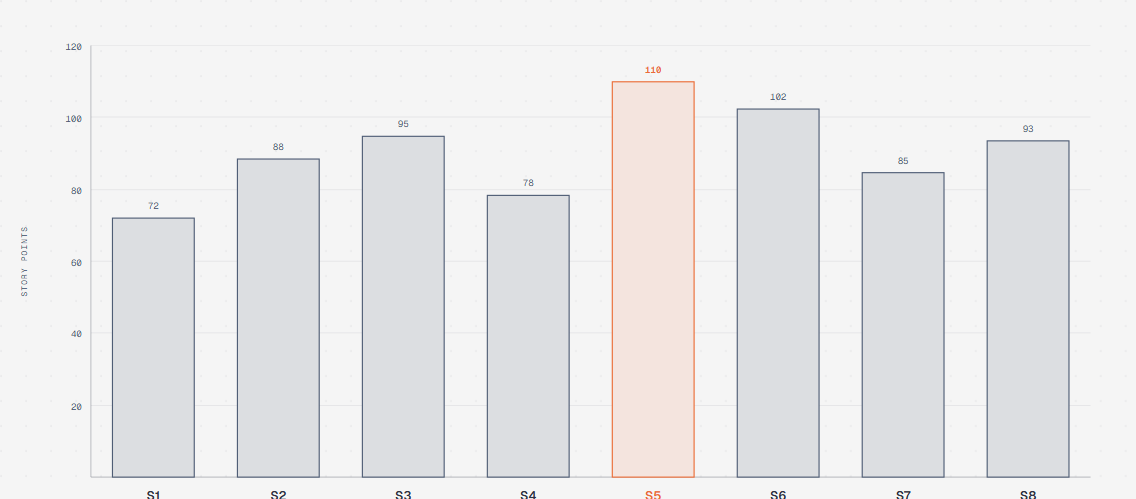 Bar chart Categorical comparison |
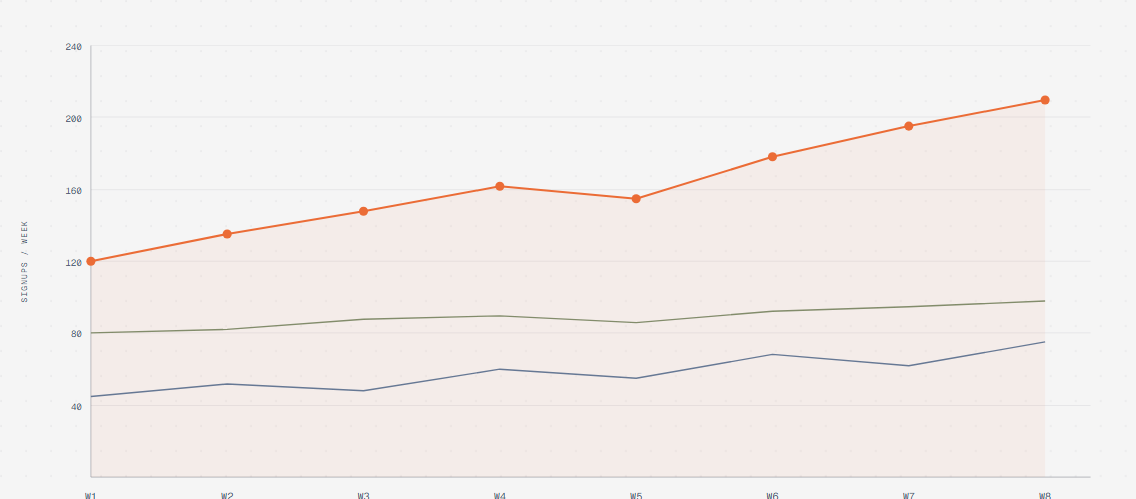 Line chart Trends over time |
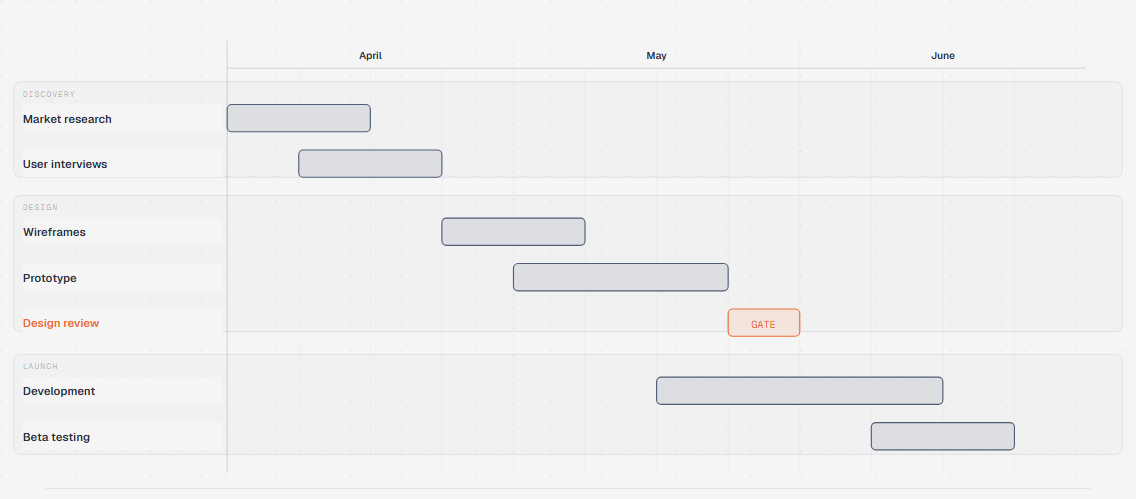 Gantt Tasks and phases on a timeline |
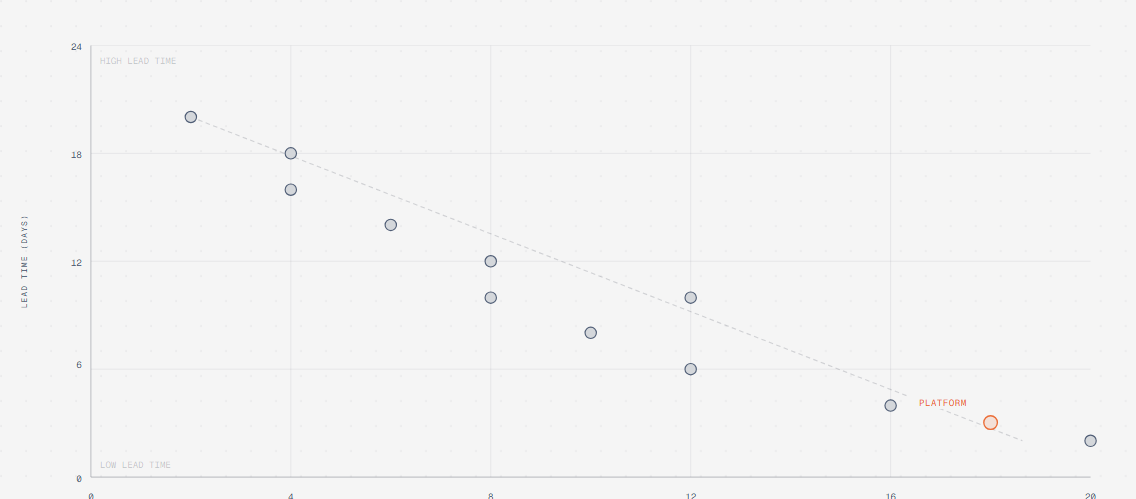 Scatter plot Distribution and correlation |
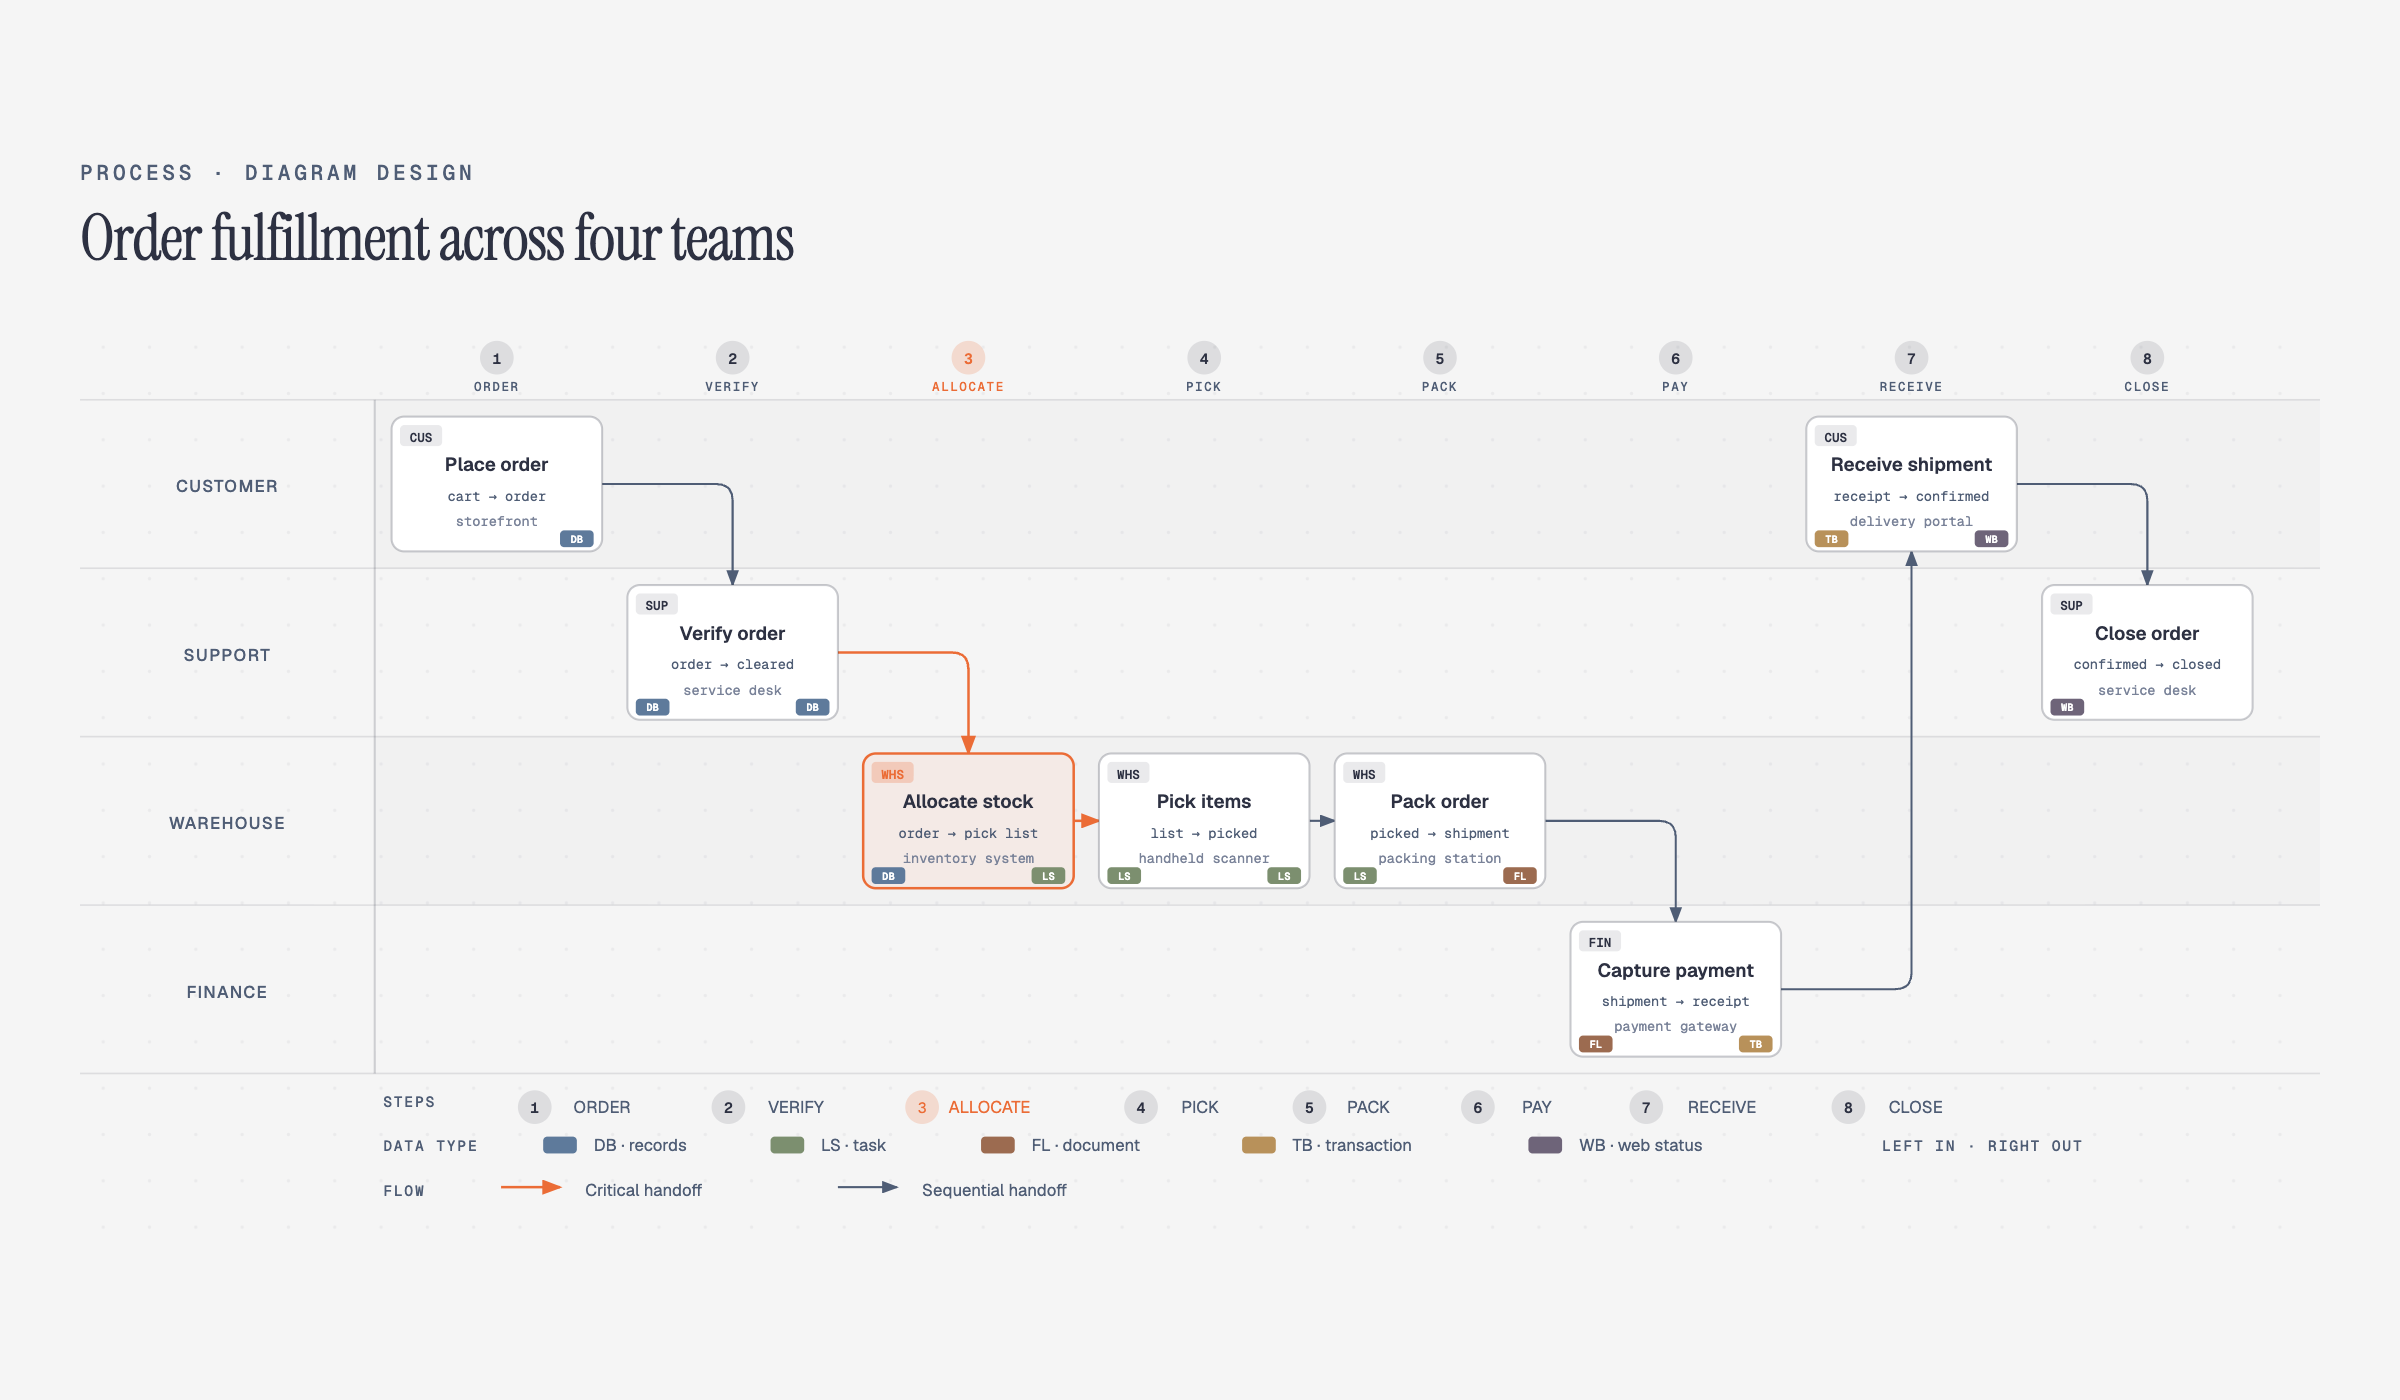 Process Multi-actor sequential workflow |
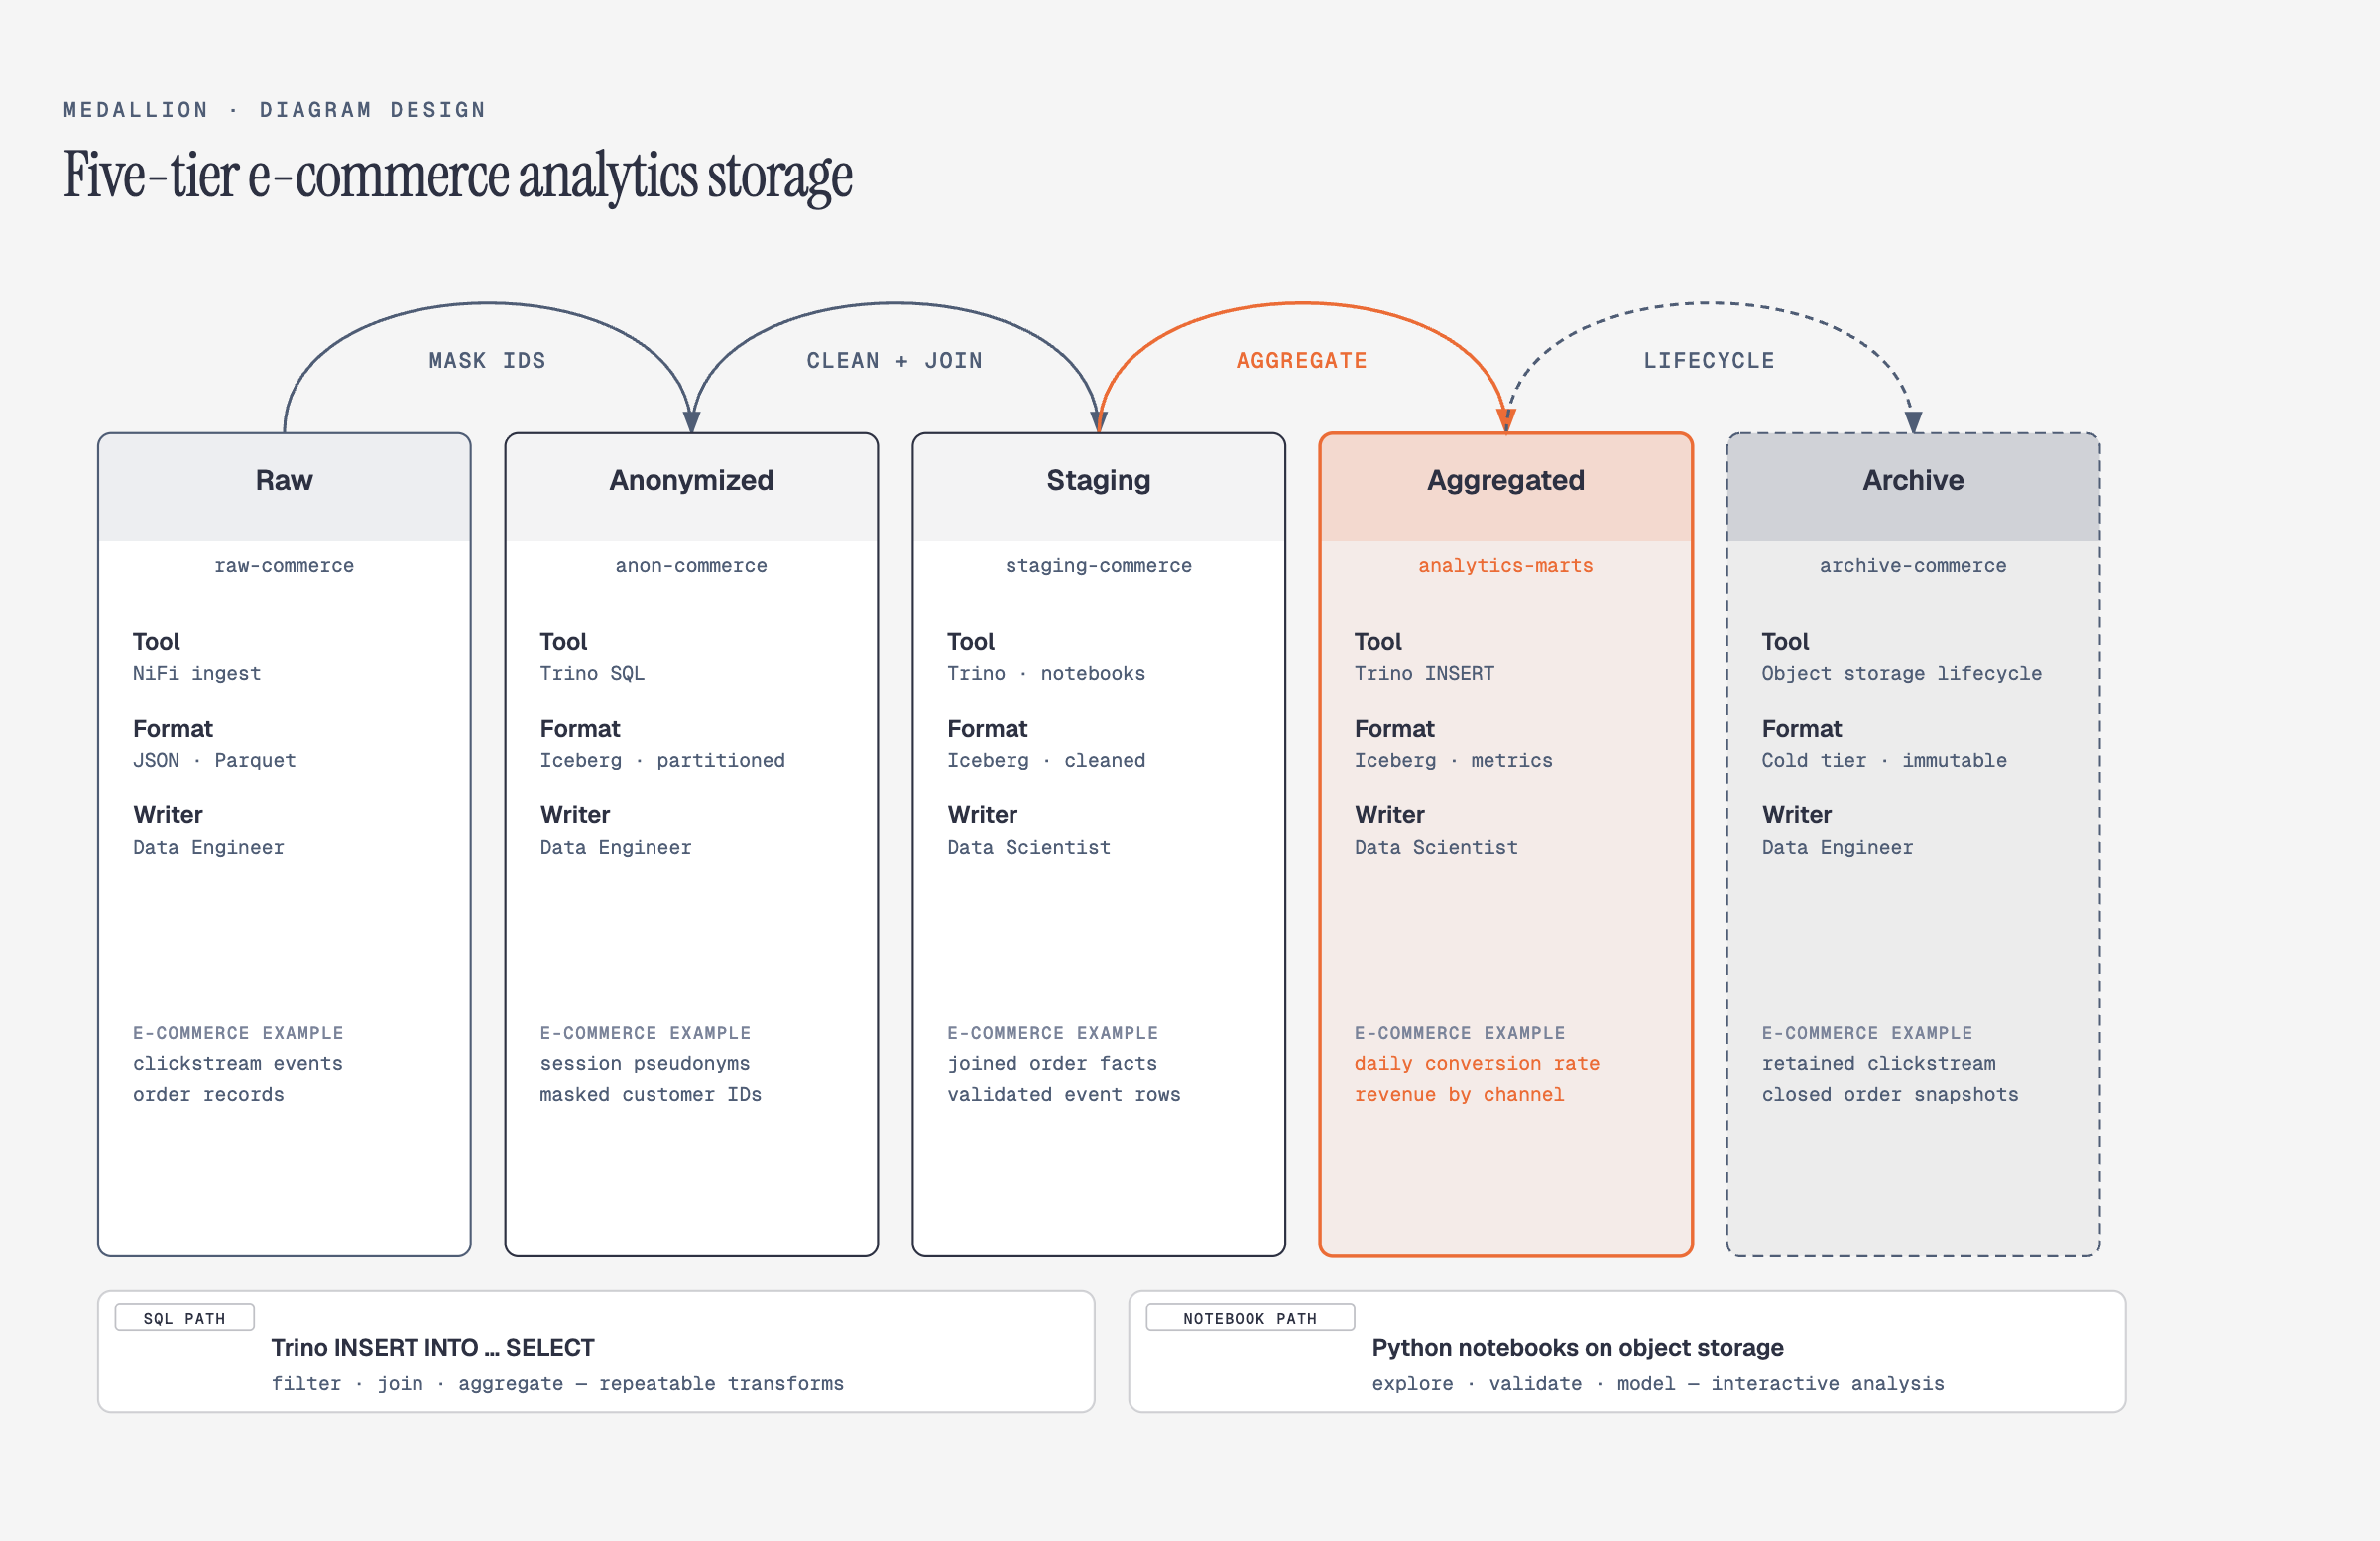 Medallion Multi-tier data storage |
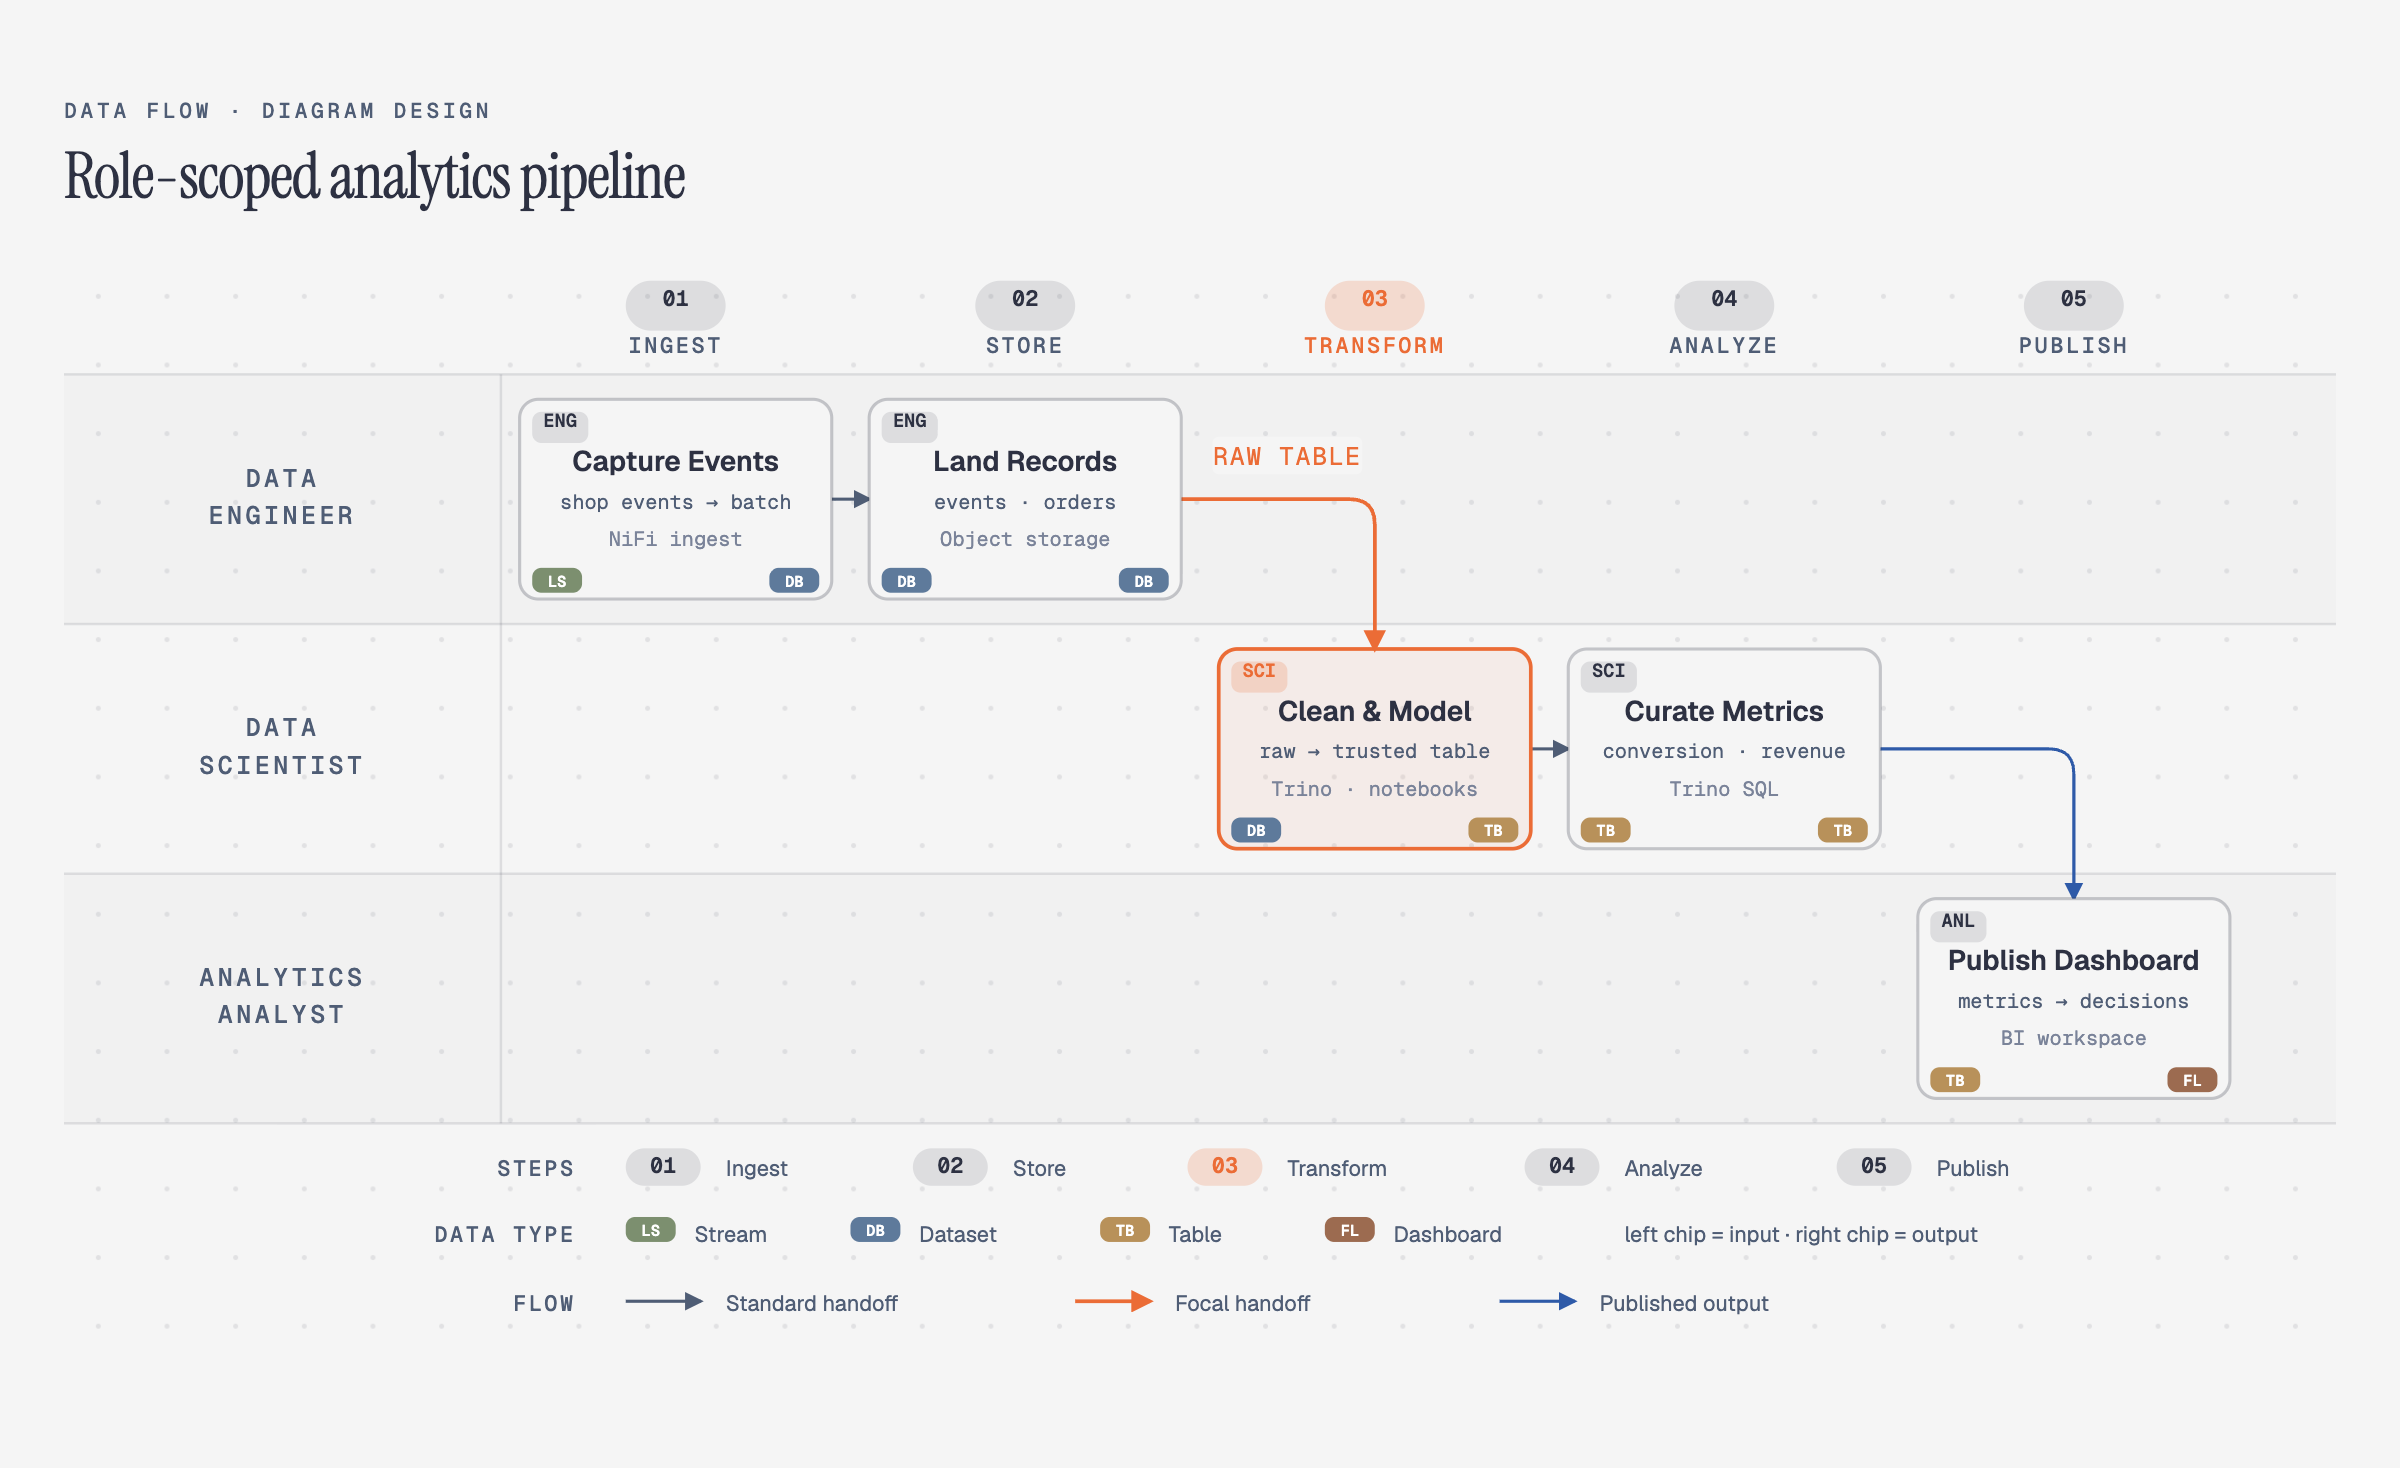 Data flow Role-scoped pipeline steps |
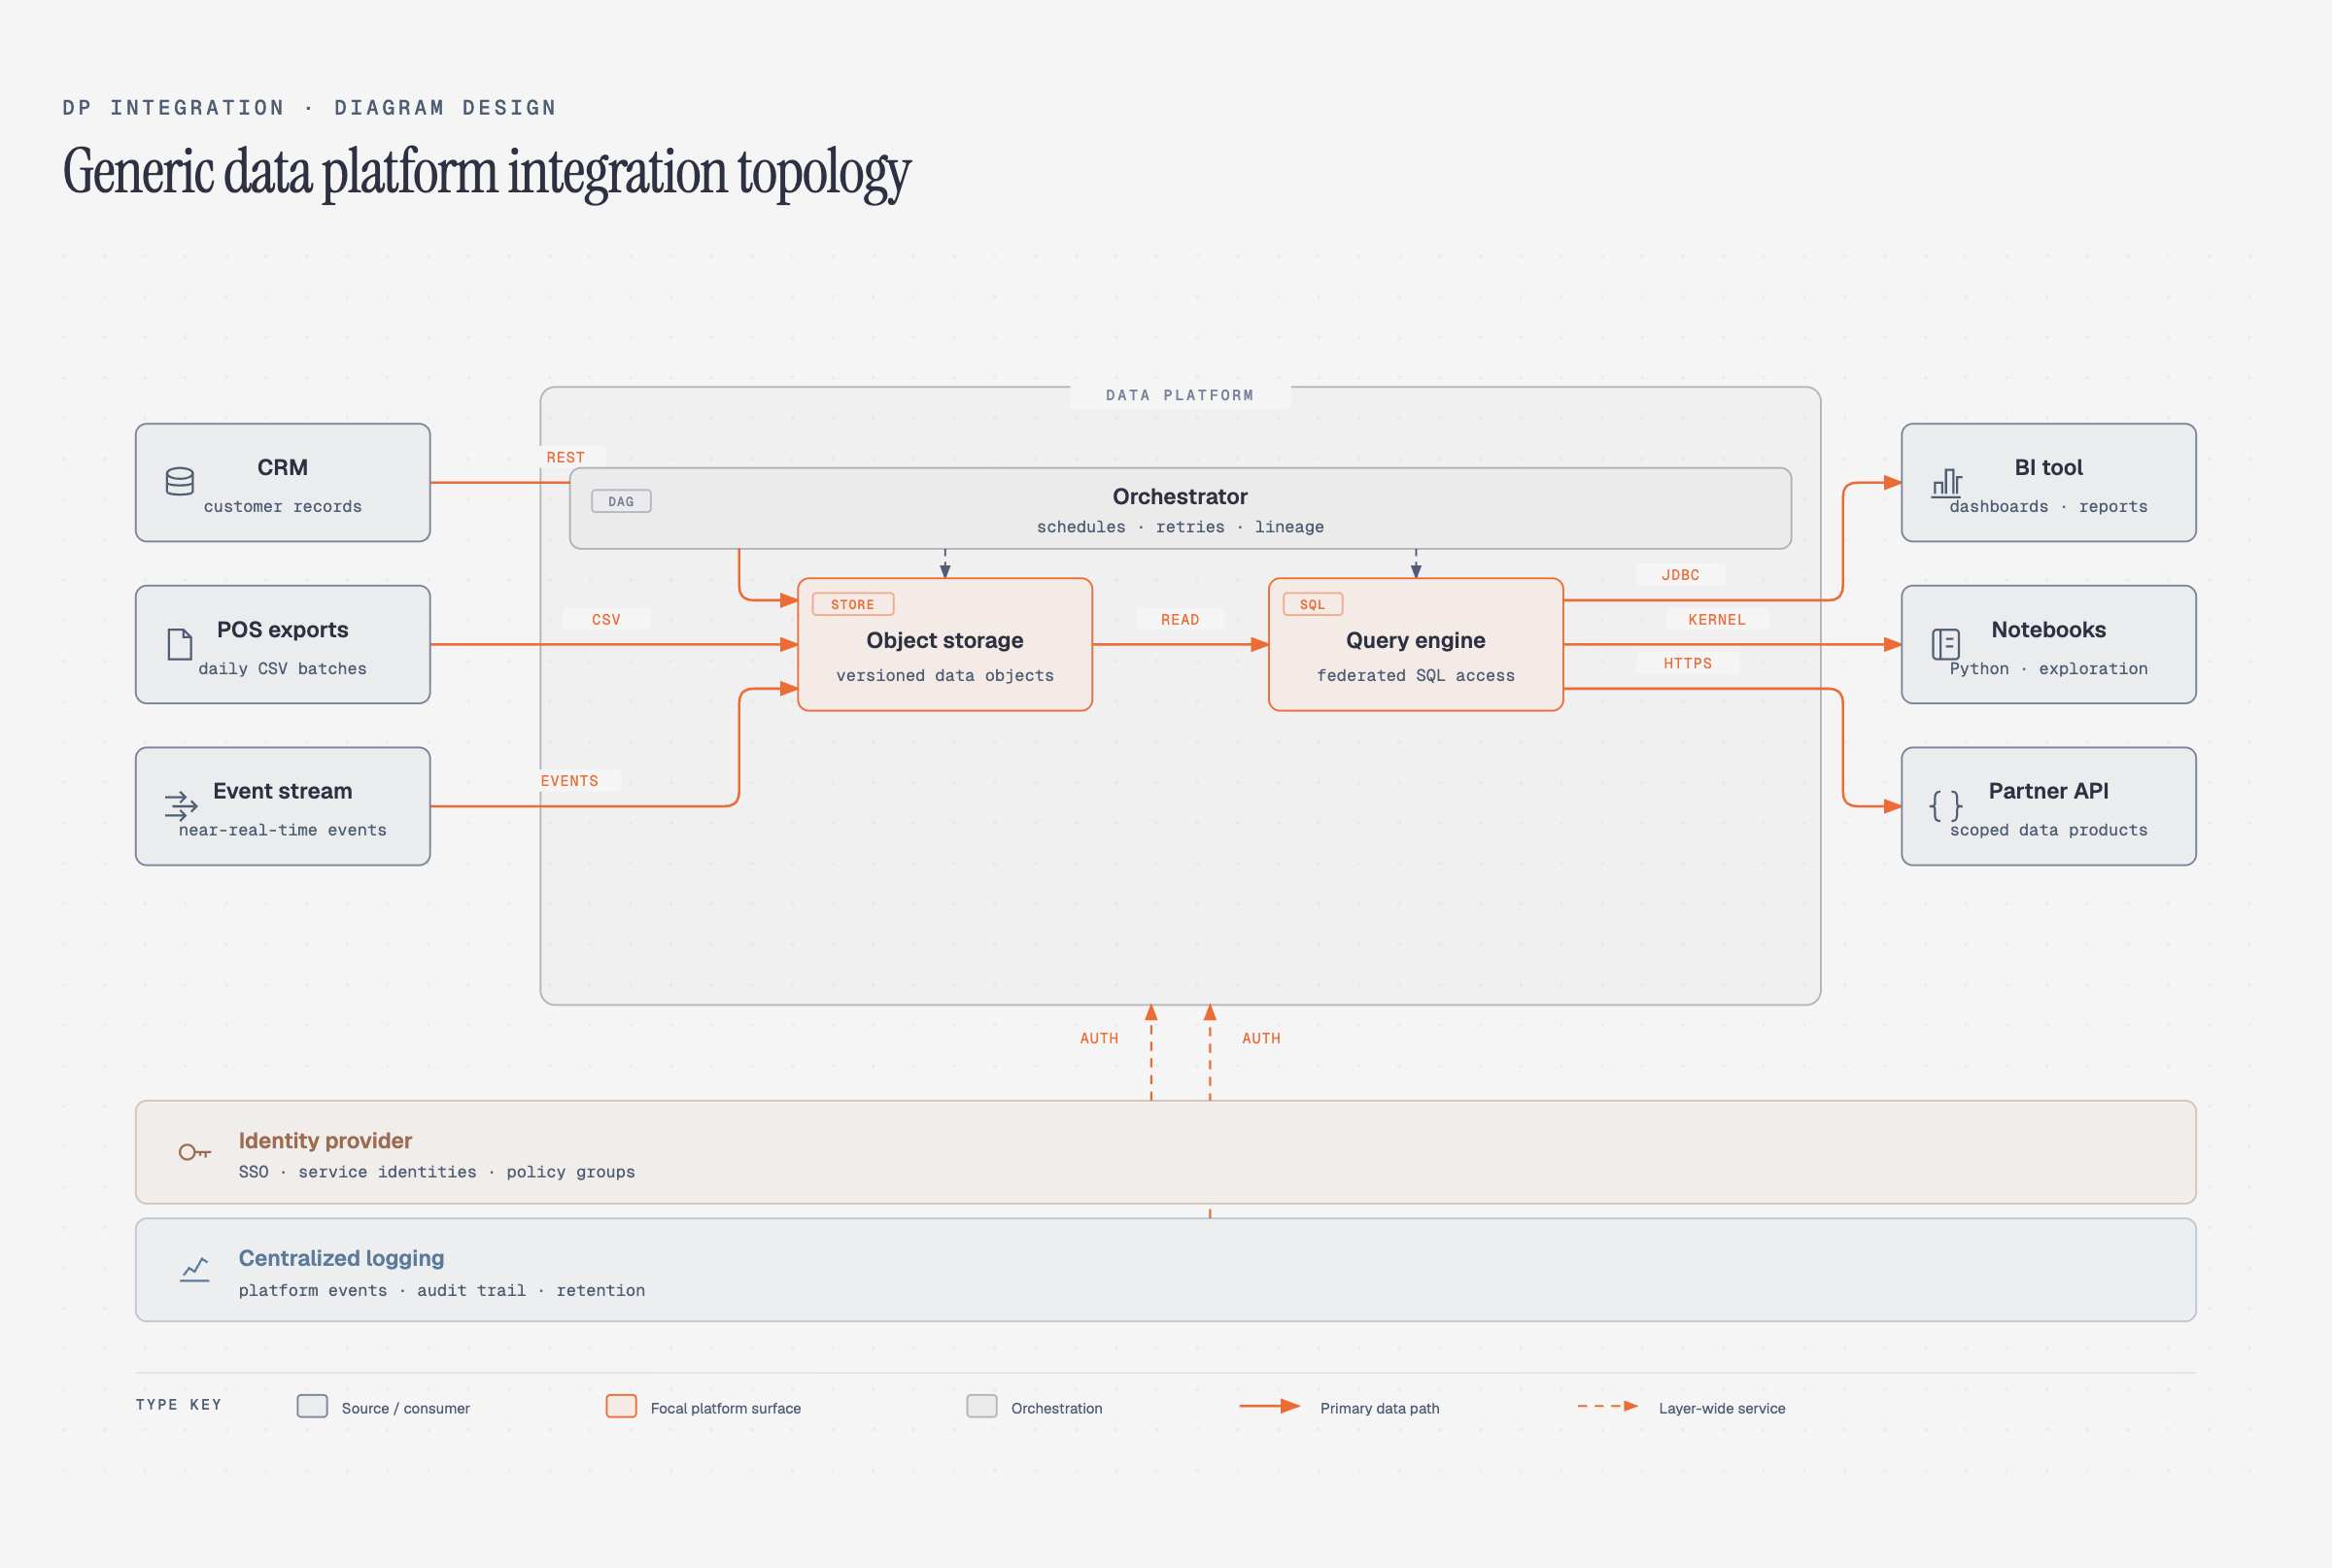 DP integration Sources → core → consumers |
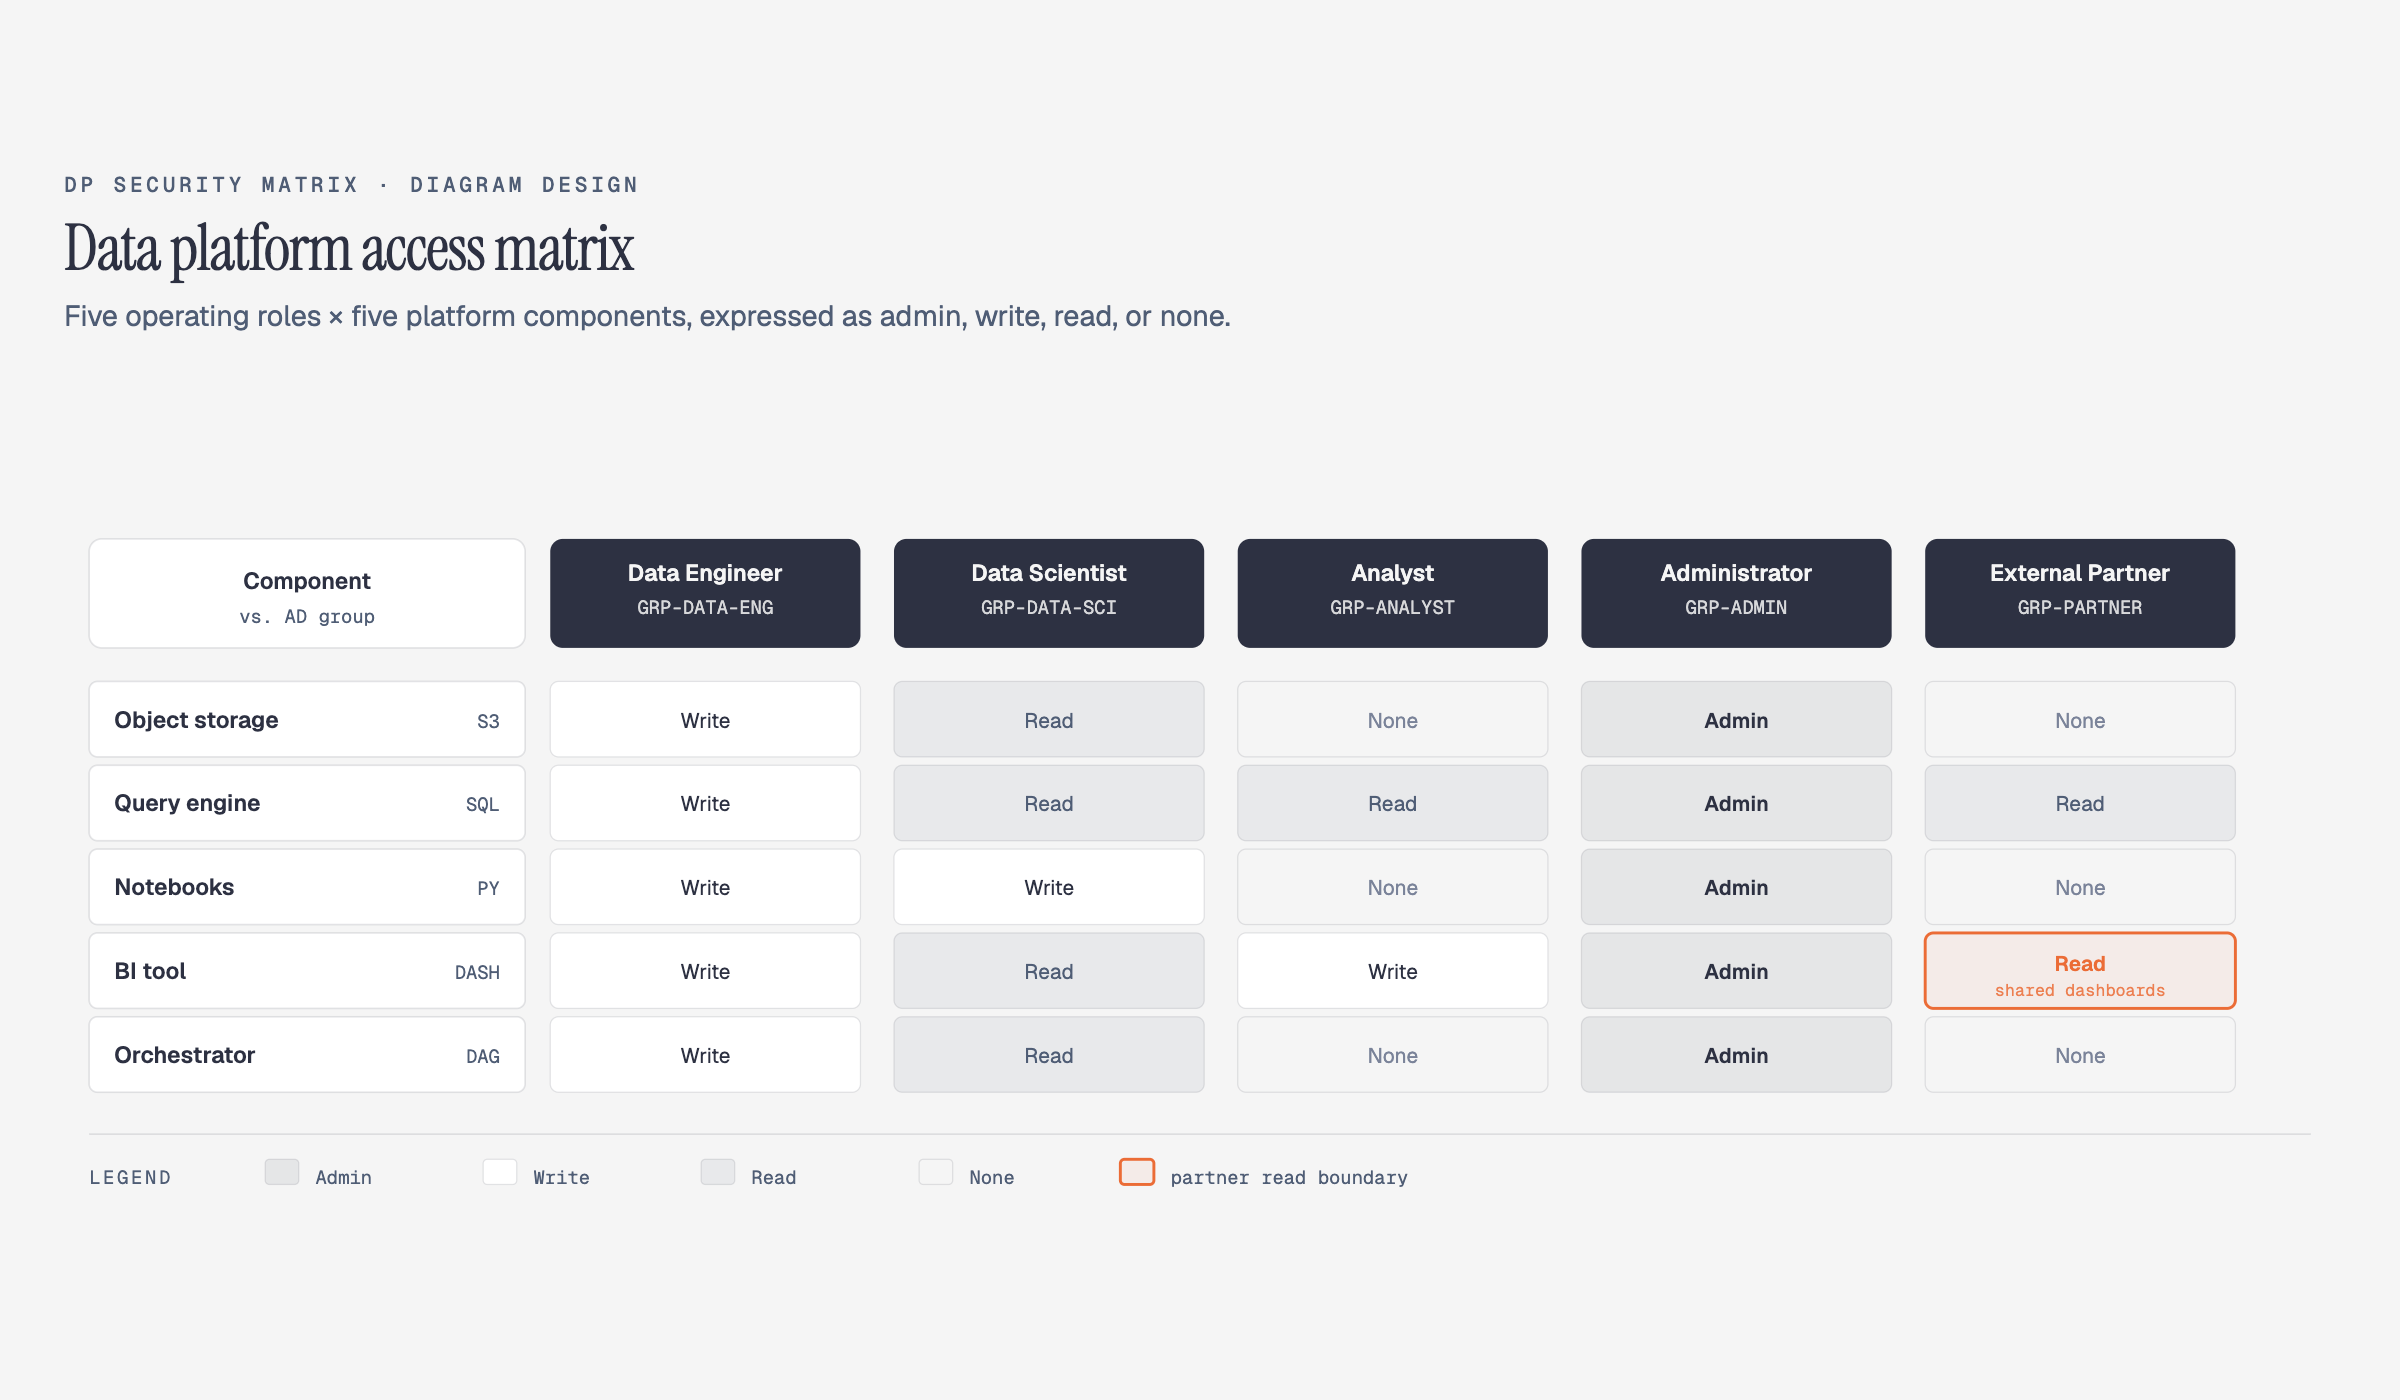 DP security matrix Per-role access permissions |
How the Skill Architecture Works
The project uses a "progressive context disclosure" principle. The SKILL.md file serves only as a table of contents. When you ask to draw a flowchart, the AI loads the type-flowchart.md file without reading descriptions of the other 26 diagram types.
This keeps the agent's working context from getting cluttered with unnecessary information. Responses are generated faster, and the model doesn't get confused by markup rules for other diagram types.
The repository structure is organized logically:
- The
references/folder contains descriptions of each diagram type, style guides, and specific primitives. scripts/contains Python parsers for extracting structure from.drawioand Mermaid files.assets/has the generated gallery site where you can see live examples.
Installation and Practical Use
You'll need one of the supported AI assistants to get started.
In Claude Code, the plugin connects with these commands:
/plugin marketplace add cathrynlavery/diagram-design
/plugin install diagram-design@diagram-design
In Pi, installation is even simpler:
pi install https://github.com/cathrynlavery/diagram-design
After installation, you can formulate tasks in regular conversational language:
"Сделай архитектурную диаграмму приложения: фронтенд, бэкенд, база данных Postgres и кэш Redis."
"Нарисуй последовательность авторизации с обновлением токена при ошибке 401."
"Перерисуй схему из файла platform.drawio для презентации инвесторам, оставь только 6 главных блоков."
Exporting finished versions is done with a standard call:
/diagram-design:export path/to/diagram.html --png-only --scale=3
The script launches Headless Chromium via Playwright and produces a clean render without extra styling elements.
Who Will Find This Project Useful
The repository is a great helper for developers, technical writers, and startup founders. If you frequently write articles, prepare slides, or update documentation in a repository, the project will save you hours of manual work.
That said, the author immediately outlines the limitations. Don't use the tool for creating regular lists, before/after comparison tables, or single-block diagrams. For such tasks, standard text or a table in Markdown will work faster and more clearly.
Related projects