Tickflow Stock Panel: How to Build Your Own Terminal for Quantitative Stock Analysis
When you start digging into algorithmic trading and market analysis, you quickly hit the same wall. Ready-made terminals either cost an arm and a leg, or they're tied to proprietary clouds where you can't manipulate raw data yourself. If you try to build your own Frankenstein from scattered Python scripts, it all ends up as a zoo of Jupyter notebooks that crash from memory exhaustion when you try to process a couple of years of history.
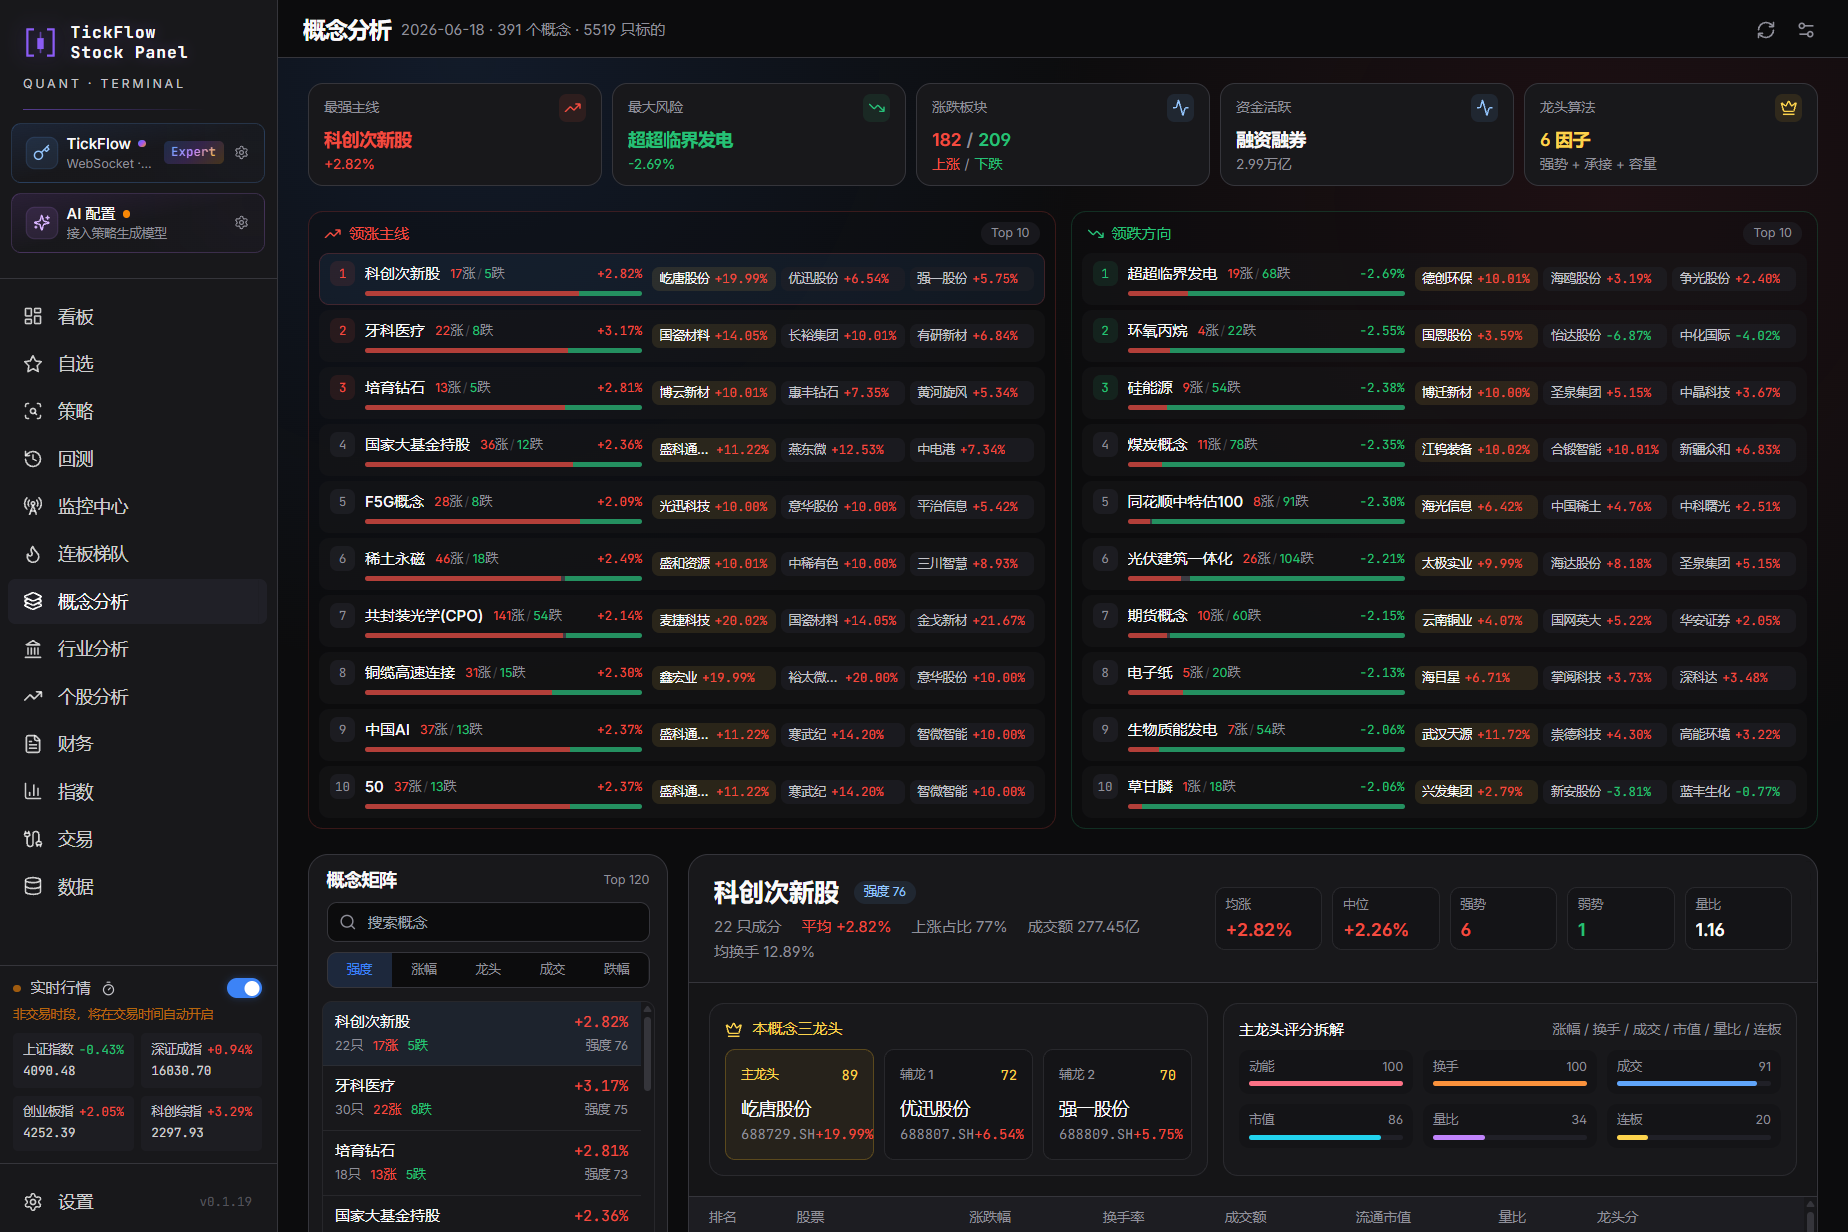
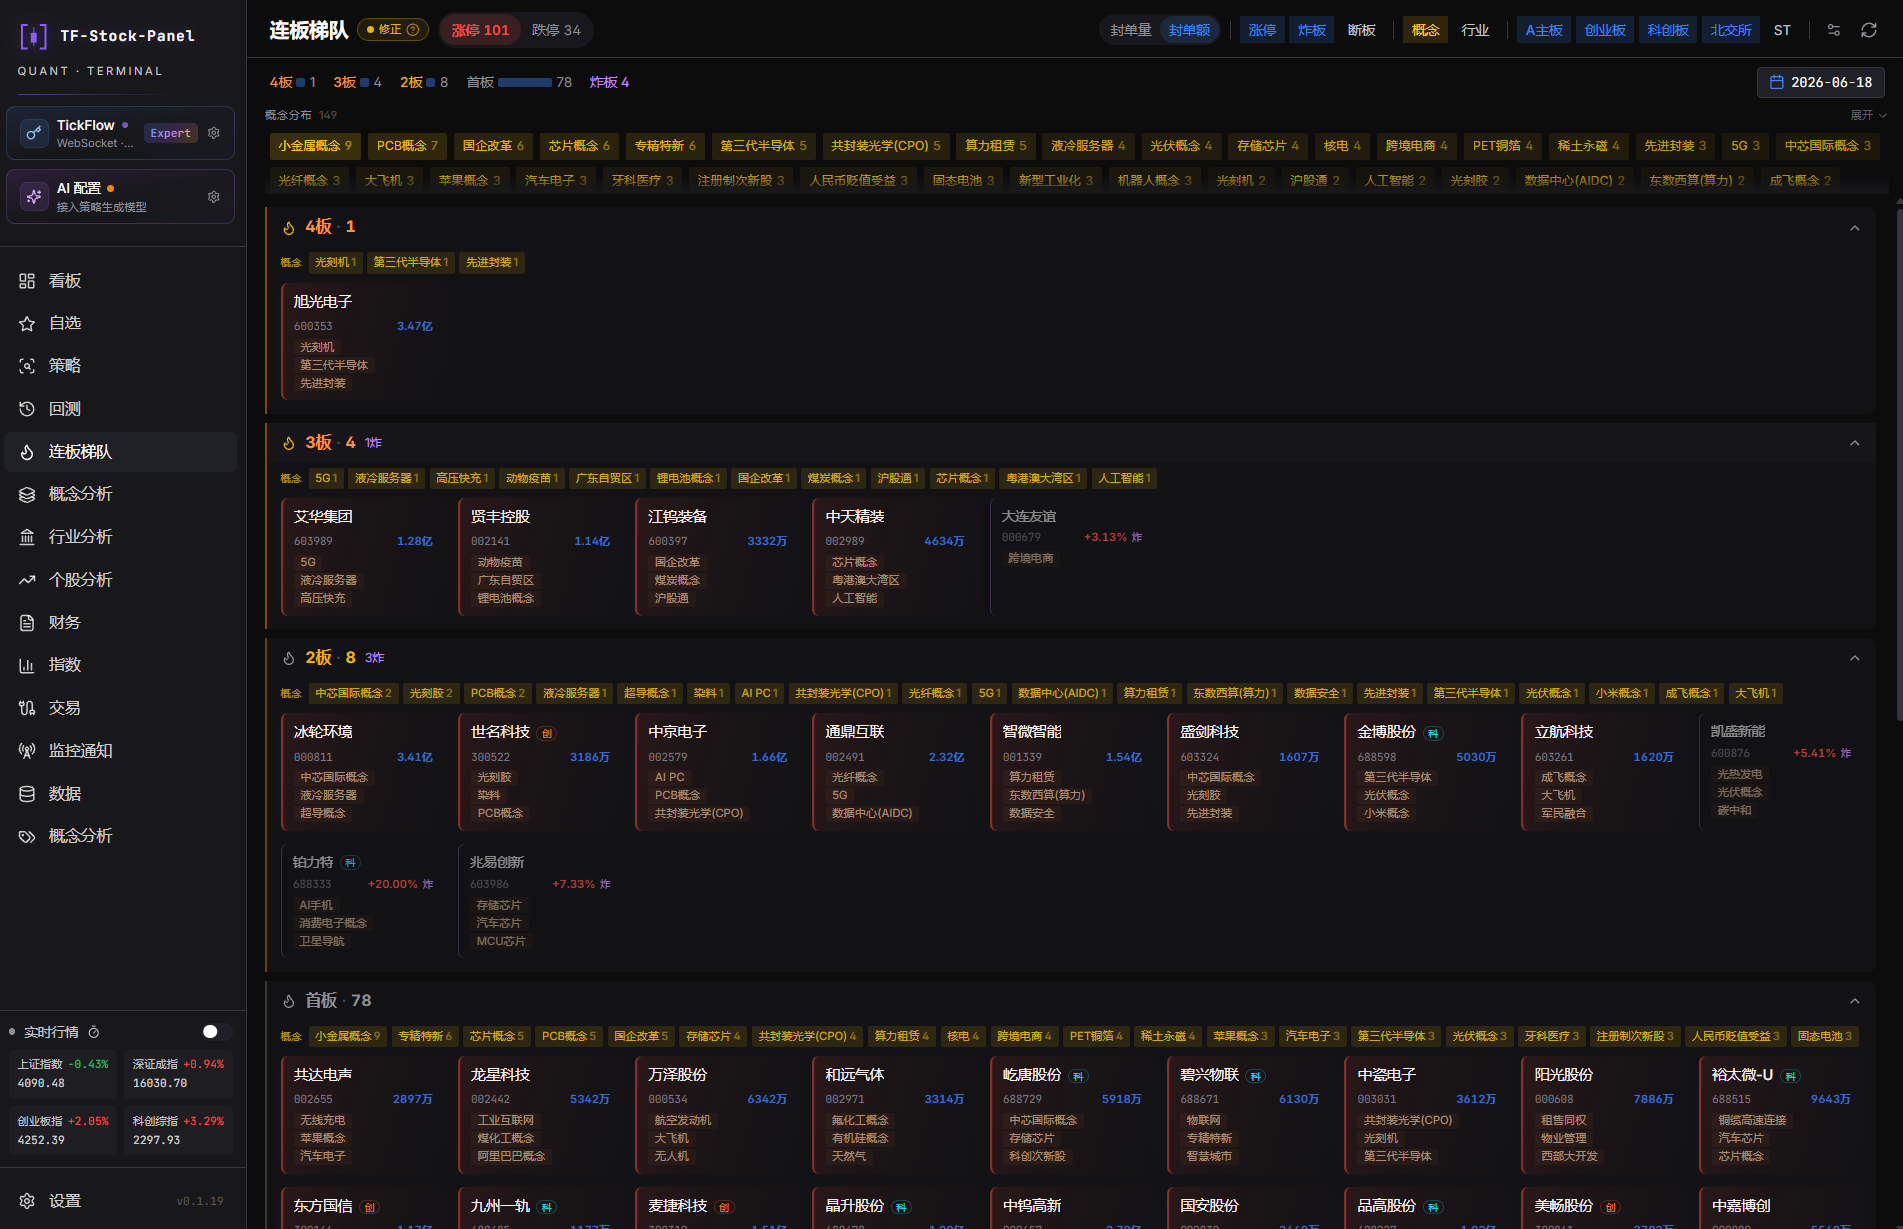
Recently stumbled upon an interesting project called tickflow-stock-panel (TSP for short). It's an open-source self-hosted panel for stock screening, backtesting, and monitoring. The project is initially focused on the Chinese A-shares market and TickFlow API, but from an engineering standpoint it's built very carefully. Inside you'll find a solid modern stack: Polars for fast table processing, DuckDB with Parquet for storage and querying, FastAPI on the backend, and clean React on the frontend.
What the panel can do
The repository author makes a clear disclaimer upfront: the project doesn't try to replace broker terminals like Tongdaxin or Thinkorswim, and there are no "magical AI buttons for guaranteed profits." This is a workstation for testing hypotheses and tracking signals.
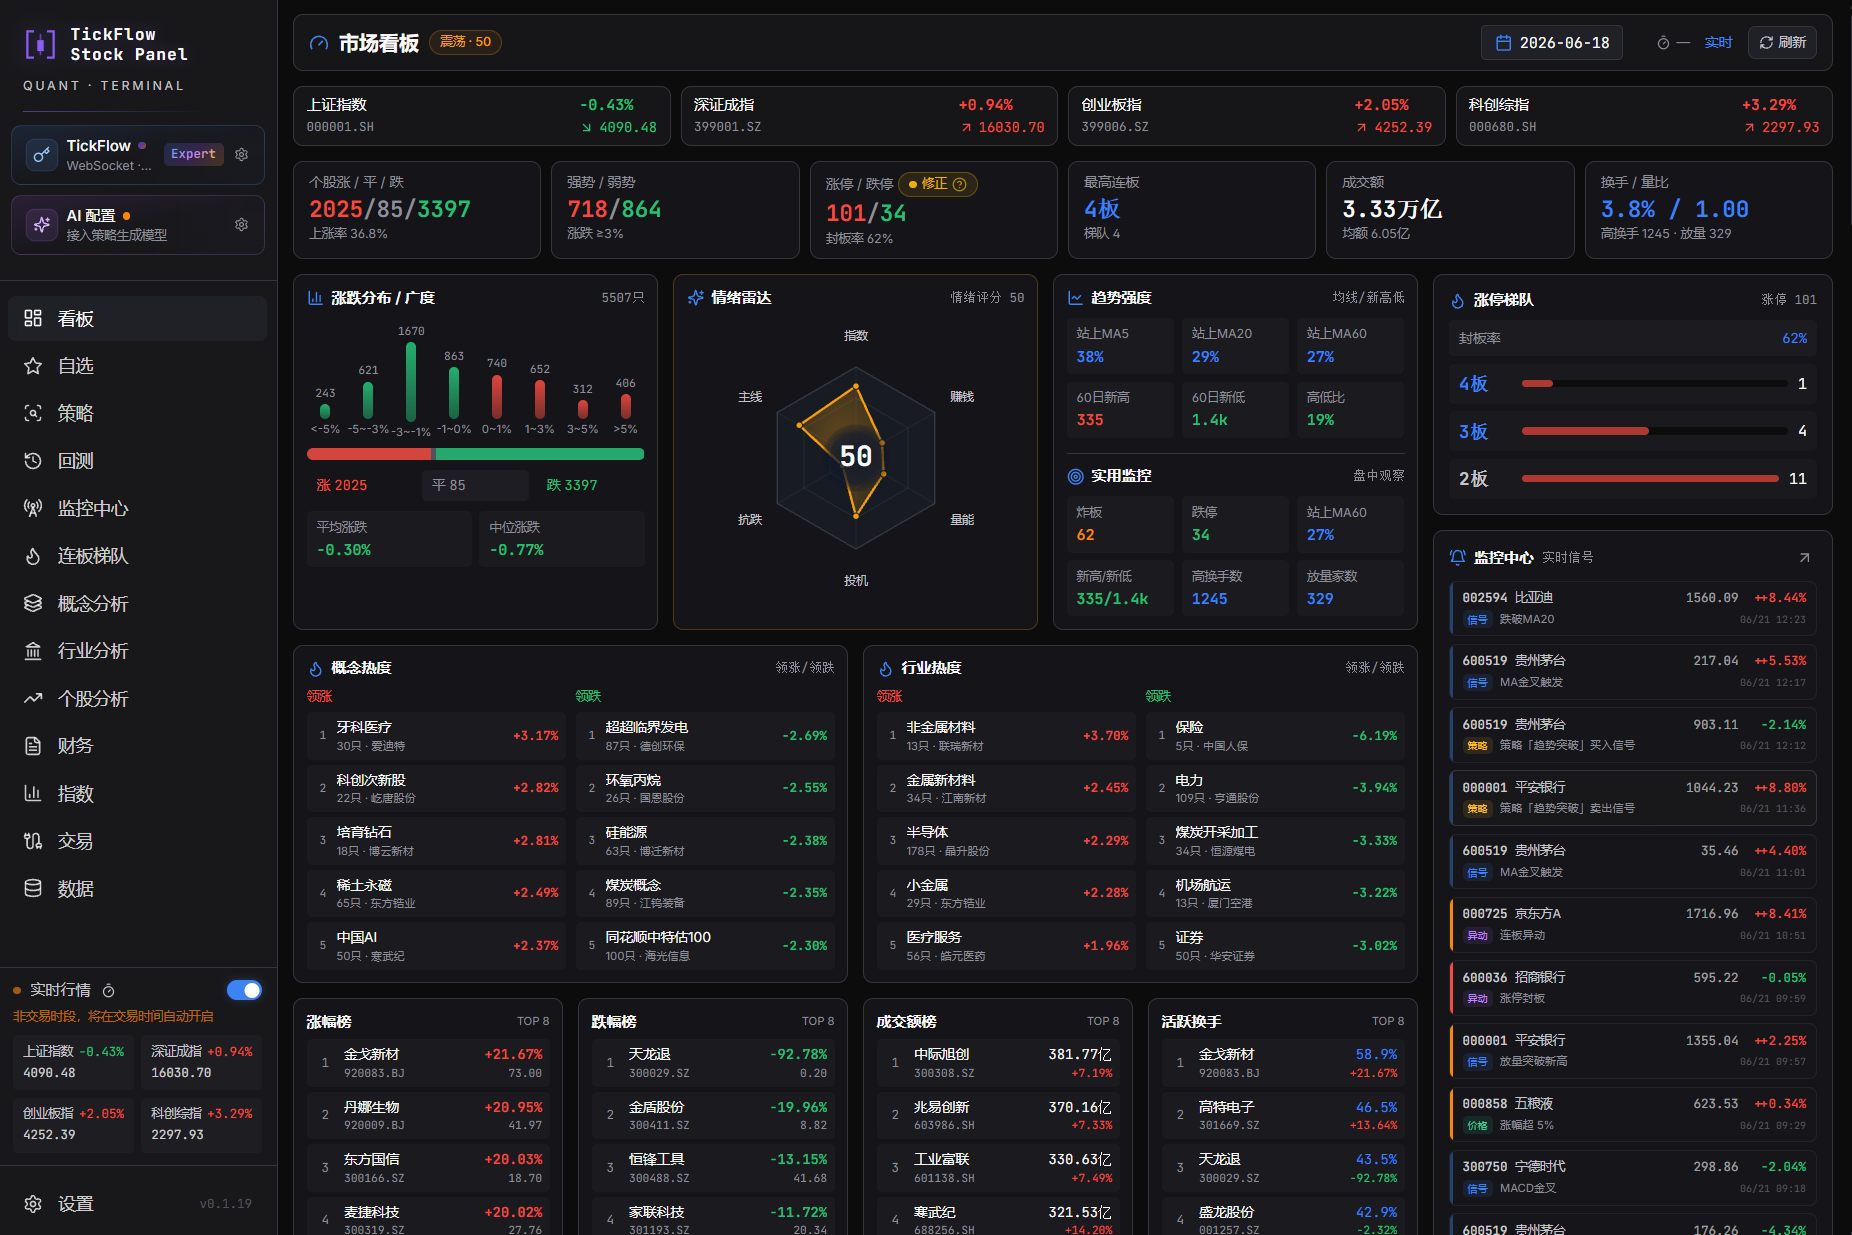
If we break down the capabilities, it's a solid set of tools:
- Stock screening and filtering. Comes with 18 built-in strategies, plus you can configure custom conditions or generate rules via LLM (supports any OpenAI-compatible API, like DeepSeek or local Ollama). Thanks to Polars, scanning the entire market across an indicator list completes in fractions of a second.
- Technical indicator calculation pipeline. The system calculates classic metrics on the fly (MA, EMA, MACD, RSI, KDJ, Bollinger Bands) and saves enriched data to local Parquet files.
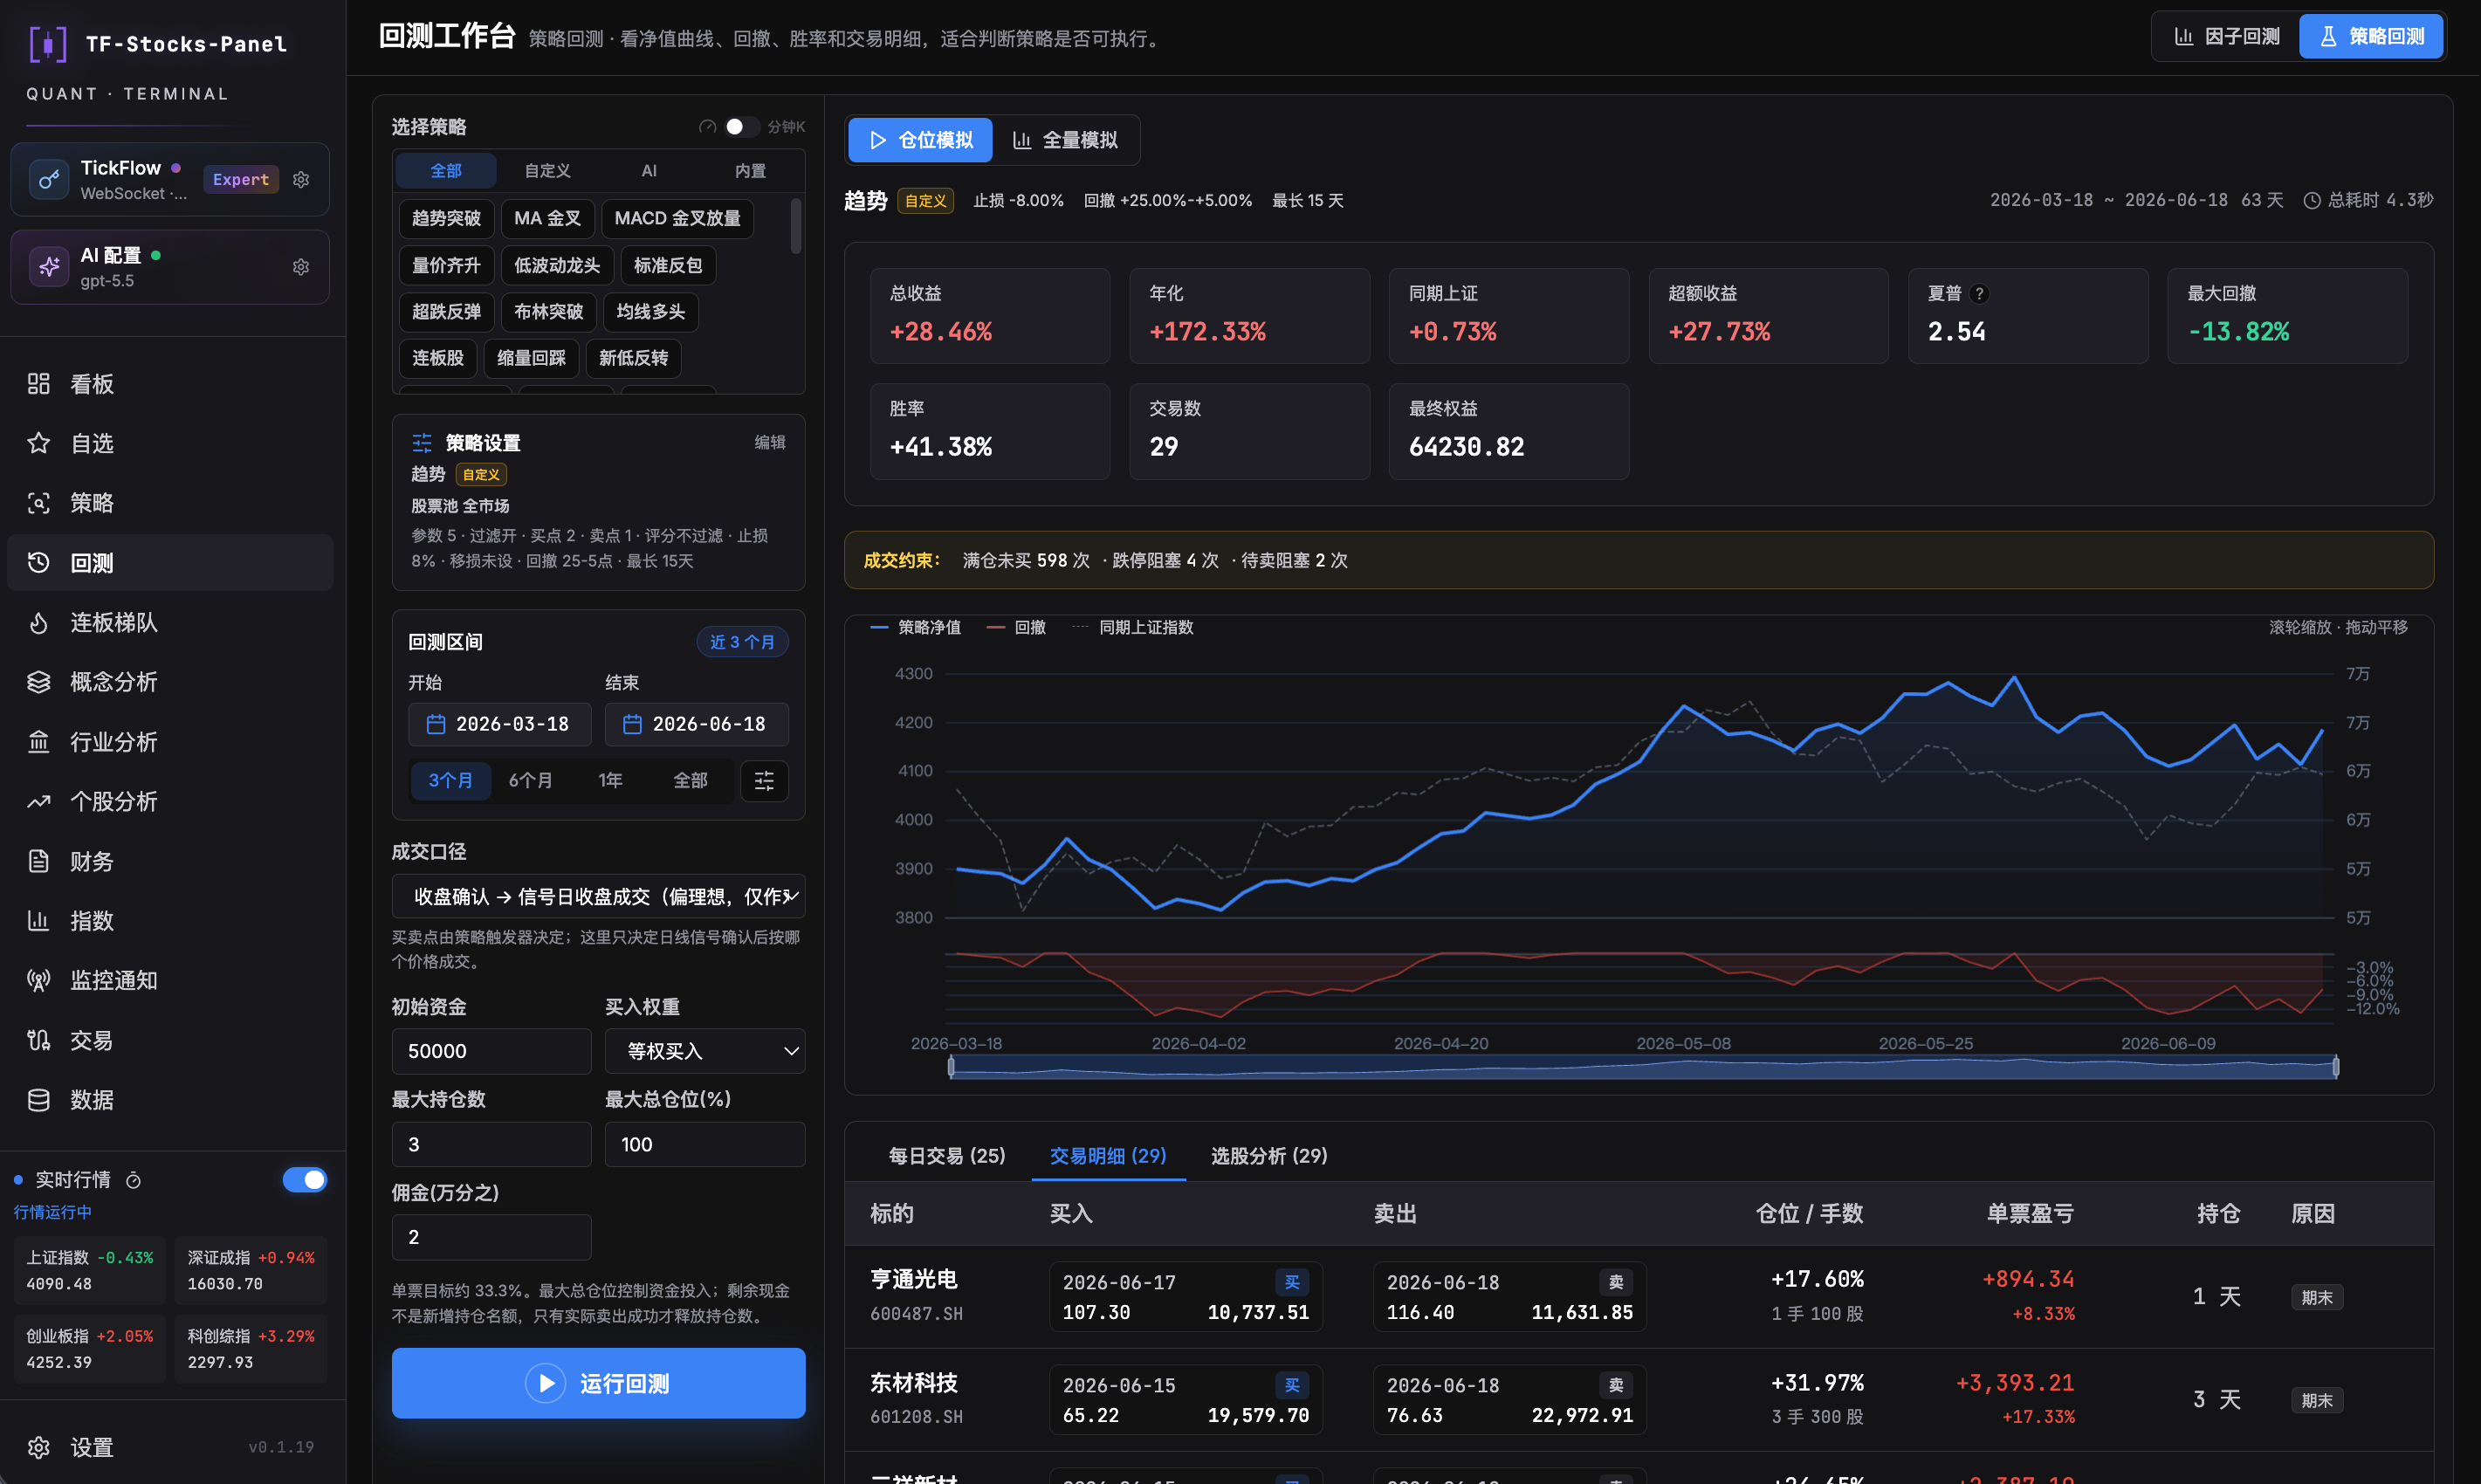
- Backtesting module. The engine can run historical tests in multiple modes (factor analysis with IC/IR metrics and full strategy backtesting). It calculates equity curves, drawdowns, Sharpe ratio, win rate accounting for commissions, slippage, and stop-losses. Execution progress is streamed to the client via Server-Sent Events in real time.
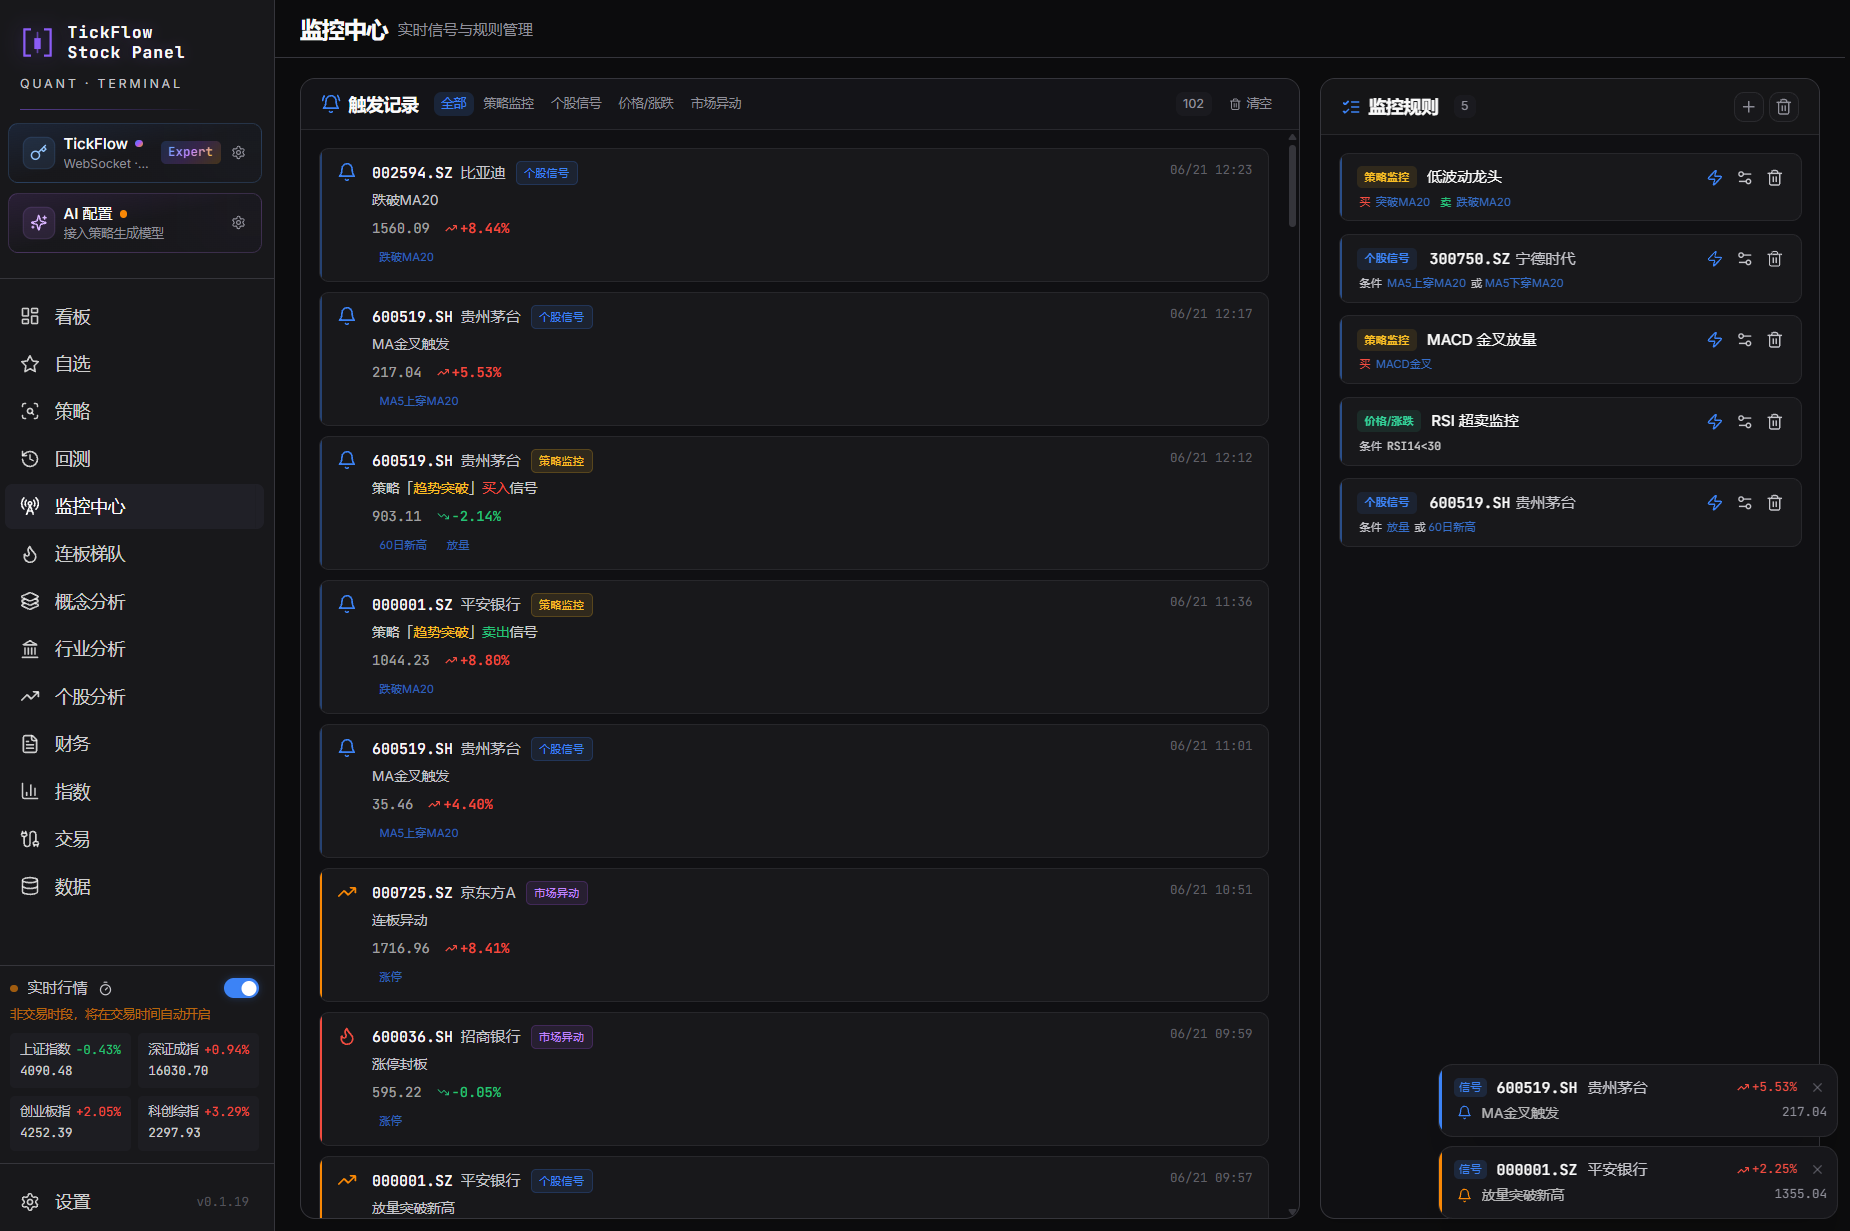
- Monitoring and alerts. You can tie rules to strategies, price levels, or market anomalies. Supports voice signals in the browser and notifications via webhooks.
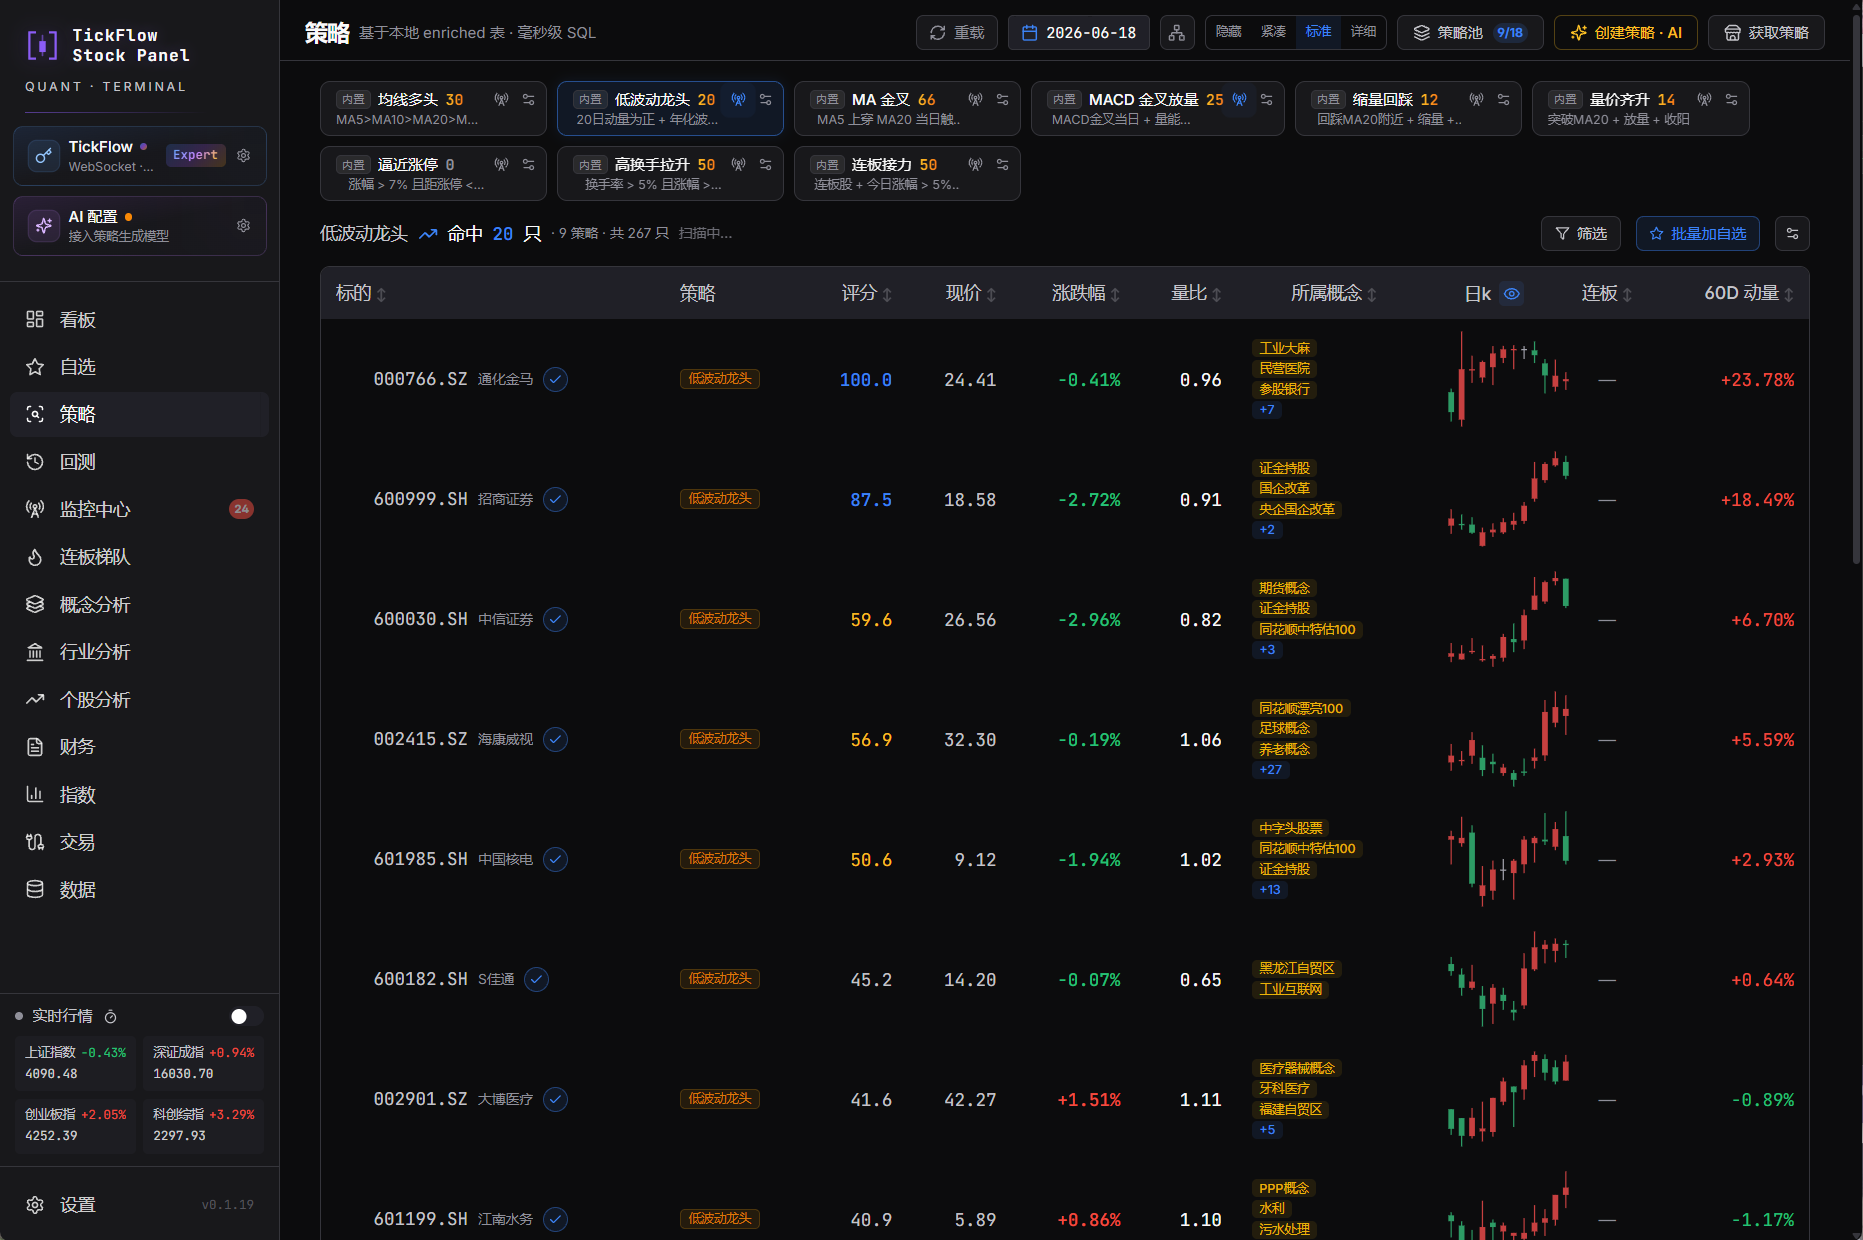
Technical stack under the hood
The project architecture deserves special attention. There's no bloated relational databases or heavy message queues here.
┌─────────────────────────────────────────────────────────┐
│                      React 18 UI                        │
│   (Vite, Tailwind, Lightweight Charts, ECharts, dnd)    │
└────────────────────────────┬────────────────────────────┘
                             │ REST / SSE
┌────────────────────────────▼────────────────────────────┐
│                    FastAPI Backend                      │
│        (Pydantic v2, APScheduler, sse-starlette)        │
└──────────────┬───────────────────────────┬──────────────┘
               │                           │
┌──────────────▼──────────────┐ ┌──────────▼──────────────┐
│       Вычисления            │ │        Хранение         │
│   Polars / vectorbt         │ │   DuckDB + Parquet      │
└─────────────────────────────┘ └─────────────────────────┘
The developer bet on local machine performance:
- Polars handles all heavy table transformations. It utilizes all CPU cores and doesn't choke on millions of rows, unlike vanilla Pandas.
- DuckDB and Parquet cover analytical queries. Data sits locally in compact binary format, read instantly without needing a running PostgreSQL or ClickHouse.
- vectorbt is used strictly at the backtesting stage, as a proven vector library for trade simulation.
- Docker with multi-stage builds packages compiled frontend and backend into a single lightweight container.
How to run locally
You can deploy the system in two ways. If you want to dig into the source code and add something of your own, the development mode is the easiest.
You'll need Python 3.11+, Node 20+, package managers uv and pnpm:
# Клонируем проект и настраиваем переменные окружения
git clone https://github.com/shy3130/tickflow-stock-panel.git
cd tickflow-stock-panel
cp .env.example .env

# Запуск dev-скрипта (поднимет фронтенд на :3011 и бэкенд на :3018)
./dev.sh
The second option is plain Docker Compose:
cp .env.example .env
docker compose up --build
After startup, the web interface is available at http://localhost:3018.
The base config in .env is minimal:
TICKFLOW_API_KEY=              # Ключ данных (можно оставить пустым для базовой истории)
AI_API_KEY=                    # Ключ LLM (OpenAI-compatible) для автогенерации стратегий
PORT=3018                      # Порт веб-сервера
If you're not trading the Chinese market, the project is still interesting. The architecture for connecting custom data sources is documented in docs/custom-data-source.md. You can feed in your own CSV, JSON, or write an adapter for MOEX / Yahoo Finance / crypto exchanges, reusing the ready-made screening interface, charts, and vector testing engine.
Who this project is for
First and foremost, the repository will be appreciated by developers interested in fintech and algorithmic trading.
On one hand, it's a ready-to-use tool for those looking for a lightweight self-hosted monitoring system without extra infrastructure hassle. On the other hand, the codebase serves as a clear example of how to properly tie FastAPI, Polars, and DuckDB into a single responsive application with streaming responses and interactive charts.
If you've been meaning to write your own screener or backtester, it's worth checking out the shy3130/tickflow-stock-panel repository at least for its data handling approaches.
Related projects