How to Track Open Source Project Growth with Star History
When choosing a library for a new project or comparing alternatives, the star count on GitHub can be misleading. Five thousand stars on a five-year-old project and five thousand stars on a repository that launched six months ago tell completely different stories. The first one might have an abandoned maintainer, while the second is experiencing explosive growth with an active influx of contributors.
GitHub itself only displays the current star count. The platform doesn't provide historical trend data out of the box. That's why the community has long relied on Star History — a tool that transforms raw numbers into visual graphs of popularity.
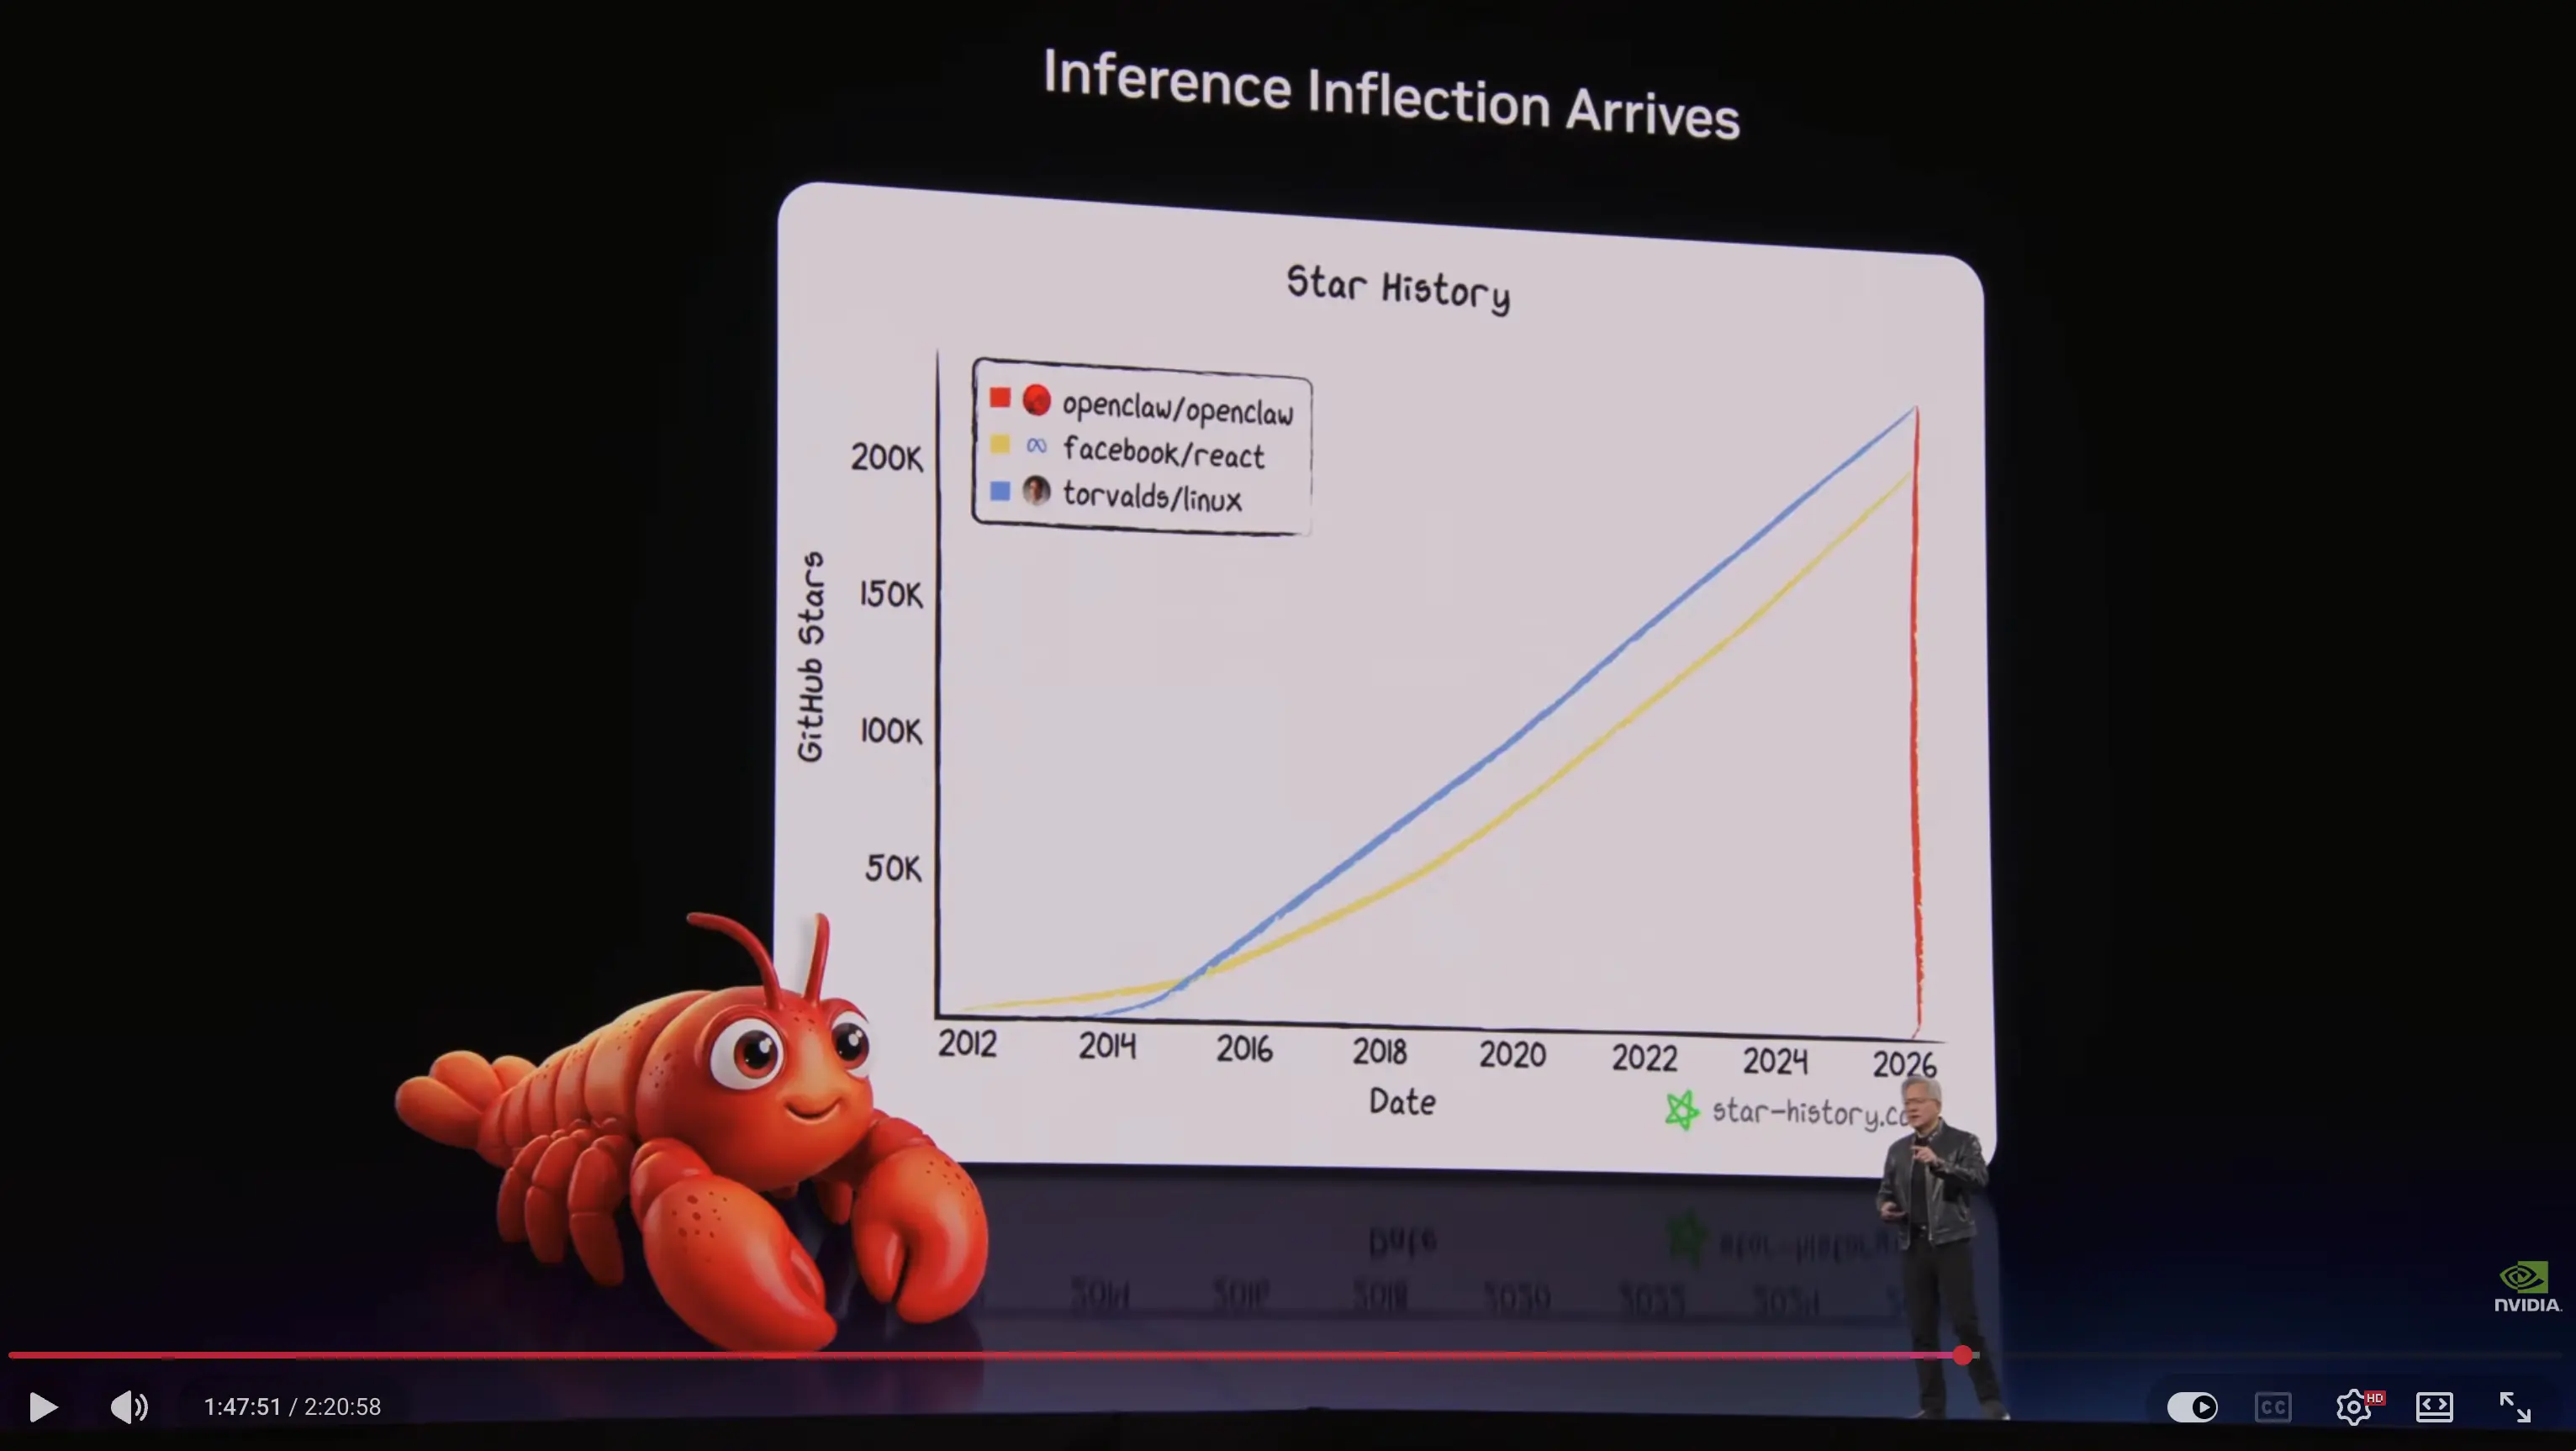
What the service can do
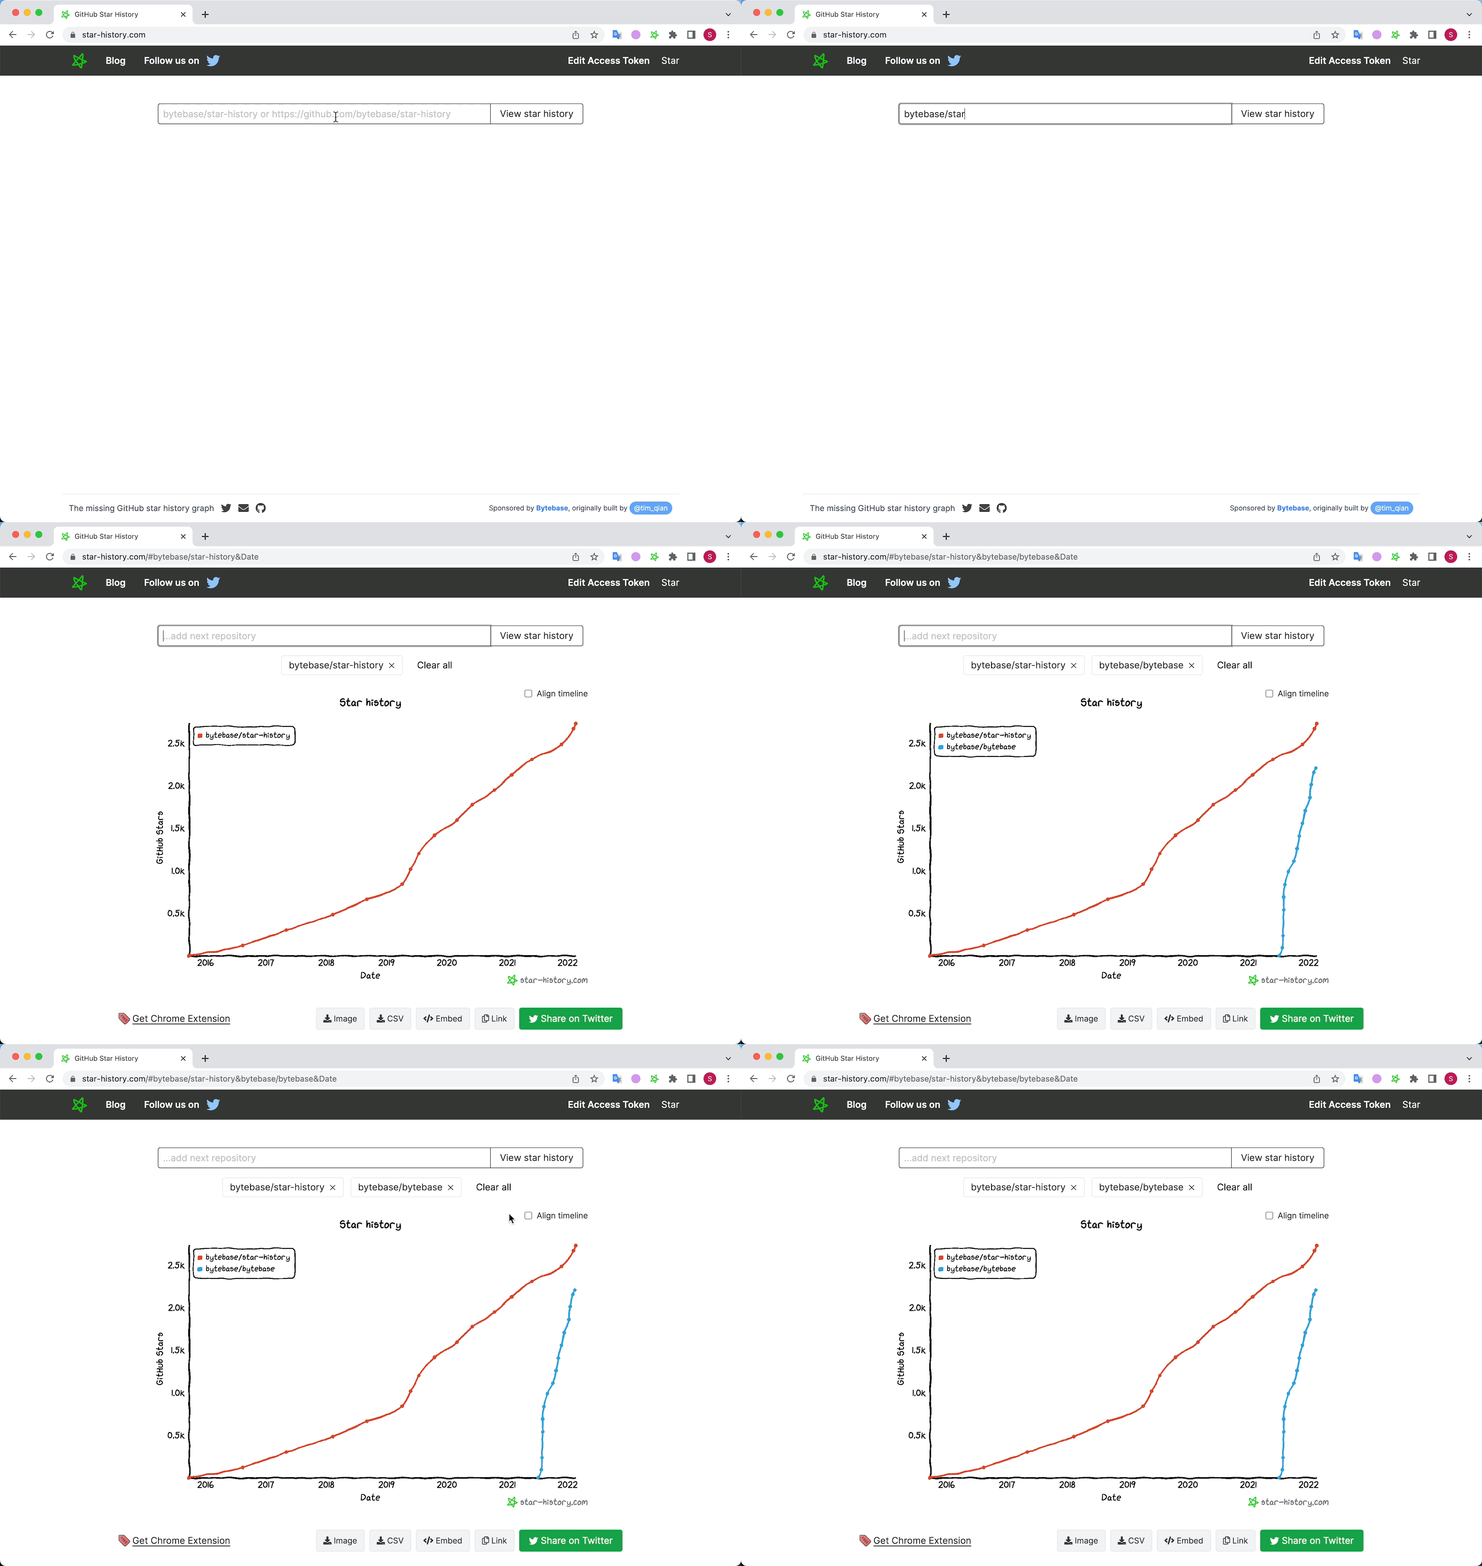
The project runs as a web service at star-history.com, but all of its source code is open under the MIT license. You enter a repository name and immediately see the curve of stars accumulated over time.
Here are the main things people use it for:
- xkcd-style comic graphs. The lines look slightly hand-drawn and casual, making the charts instantly recognizable in presentations and articles.
- Compare multiple repositories on a single screen. You can overlay competitor graphs (for example, Vue vs. React and Svelte) and see exactly when a trend reversal happened.
- Switch display modes. You can view data by exact calendar dates or align it to a timeline from each repository's creation date.
- Embeddable live SVG charts and badges for README files.
How to embed a chart in your README
Many popular library authors embed the star history chart right in the project description. This immediately shows visitors the growth pace of the community.
This is done by calling the service's API. Here's what the markup looks like with support for dark and light themes:
<a href="https://star-history.com/#your-username/your-repo&Date">
 <picture>
   <source media="(prefers-color-scheme: dark)" srcset="https://api.star-history.com/chart?repos=your-username/your-repo&type=Date&theme=dark" />
   <source media="(prefers-color-scheme: light)" srcset="https://api.star-history.com/chart?repos=your-username/your-repo&type=Date" />
   <img alt="Star History Chart" src="https://api.star-history.com/chart?repos=your-username/your-repo&type=Date" />
 </picture>
</a>
Beyond charts, the service generates compact badges showing the repository's global rank.
What's under the hood
The project's codebase is split into frontend, browser extension, and backend.
The frontend is written in TypeScript using Next.js and styled with Tailwind CSS. The developers use the pnpm package manager.
To run the frontend locally:
cd frontend
pnpm install
pnpm dev
After that, the web interface will be available at http://localhost:3000.
For the backend, which generates SVG chart images on the fly, a separate service is used:
cd backend
pnpm install
pnpm dev
The API server runs on port 8080.
One interesting detail: the README explicitly states that the authors don't accept external pull requests (We do not accept external contribution). The project is maintained by a specific team, so if you need custom modifications, you'll have to fork the repository for yourself.
Chrome extension
If you don't want to visit the website every time, the project offers a Chrome browser extension.
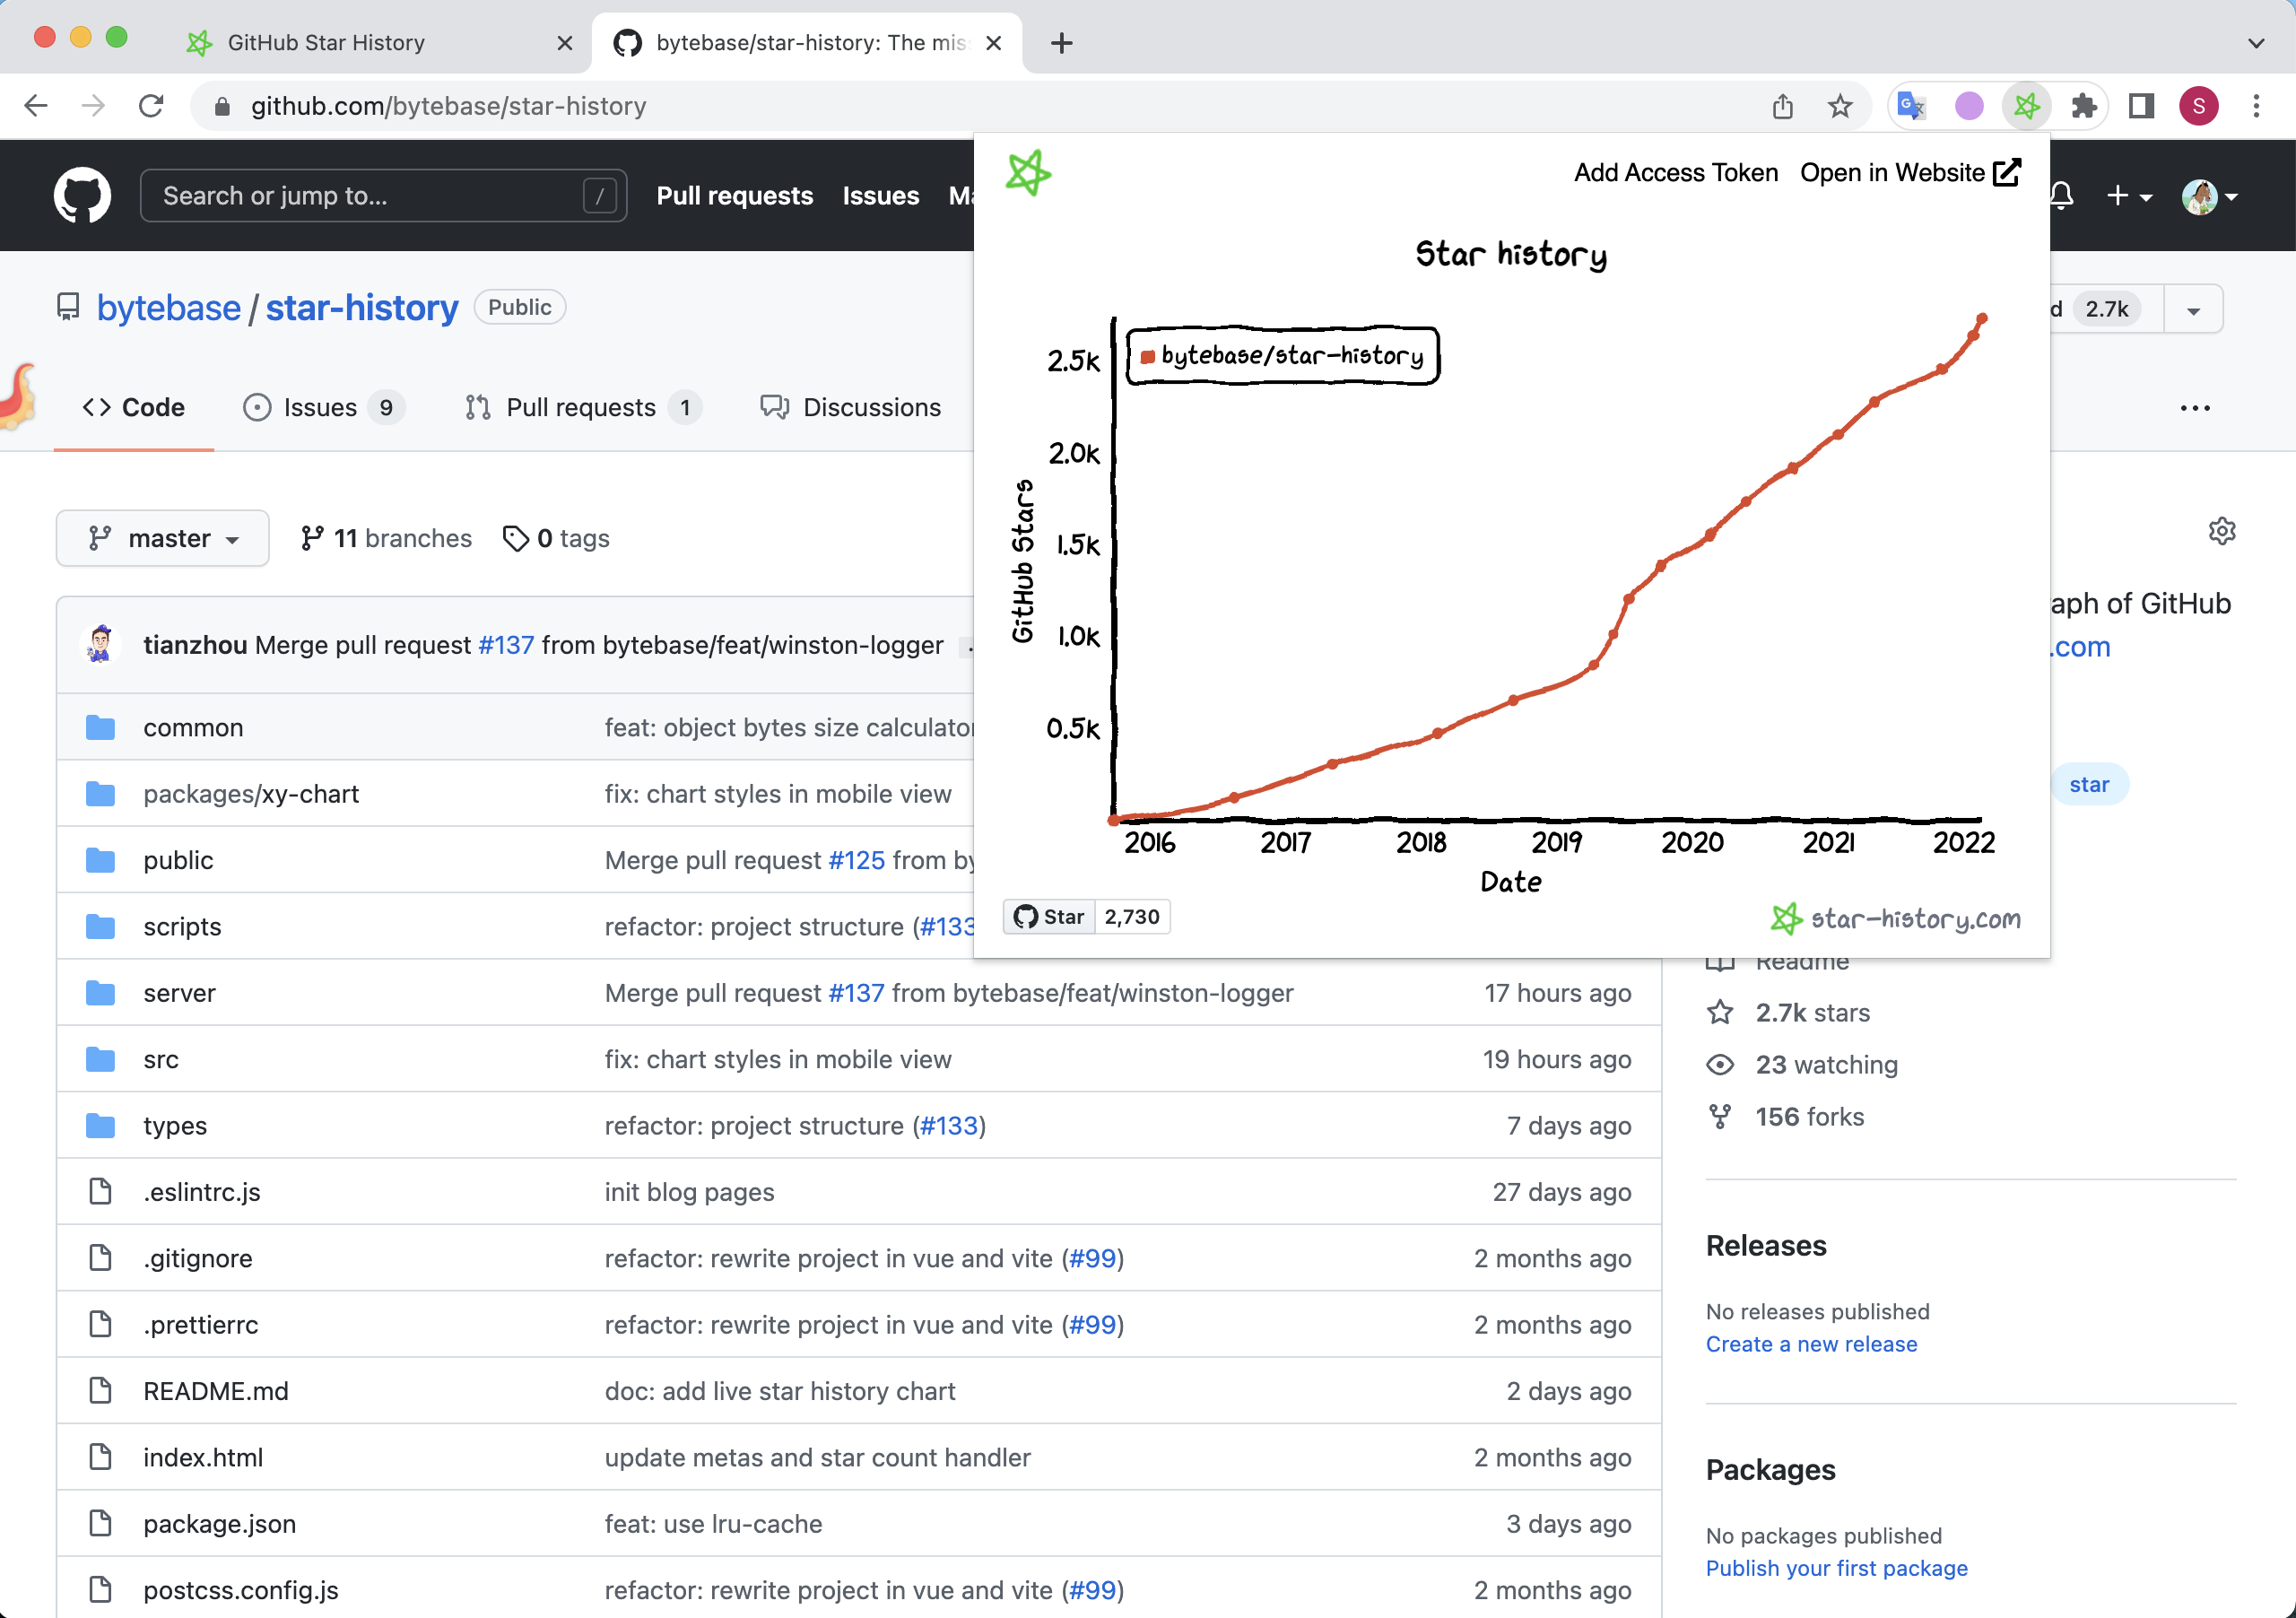
It adds a history view button right on the page of any GitHub repository. You can build it from source with a single command in the frontend folder:
cd frontend
pnpm build:ext
The ready bundle will be in the ./dist folder, from where you can load it into the browser in developer mode as an unpacked extension.
Practical scenarios
In everyday work, Star History is useful in four common situations:
- Assessing dependency health. A sharp drop in star acquisition rate often coincides with the moment when the authors abandoned the project or stopped responding to issues.
- Preparing pitches and talks. An xkcd-style chart is a great way to break up dry technical slides.
- Post-release marketing analysis. You launched a project on Hacker News or Product Hunt and want to see the audience response visually over the following days.
- Choosing between similar libraries. When you need to pick between two utilities with similar functionality, a chart helps you understand which one is gaining momentum and which is gradually fading.
Sponsors and ecosystem
The project is actively supported by commercial companies in the open source space, including Bytebase, Dify, SerpApi, and pgplex.



Star History solves one specific problem without unnecessary complexity. The service runs fast, lets you export images in a couple of clicks, and integrates easily into documentation.
If you maintain an open repository or frequently analyze other people's code, keep the site bookmarked or install the browser extension. This will save time when evaluating libraries and help you track the growth rate of your own projects.
Related projects