How to gather all your news feeds and metrics into one cozy dashboard
Have you ever caught yourself starting the morning with endless tab switching? First Reddit, then Hacker News, check the weather, see how the Docker containers are doing on the server, and whether your favorite library got an update on GitHub. By the middle of this process, your work mojo usually evaporates.
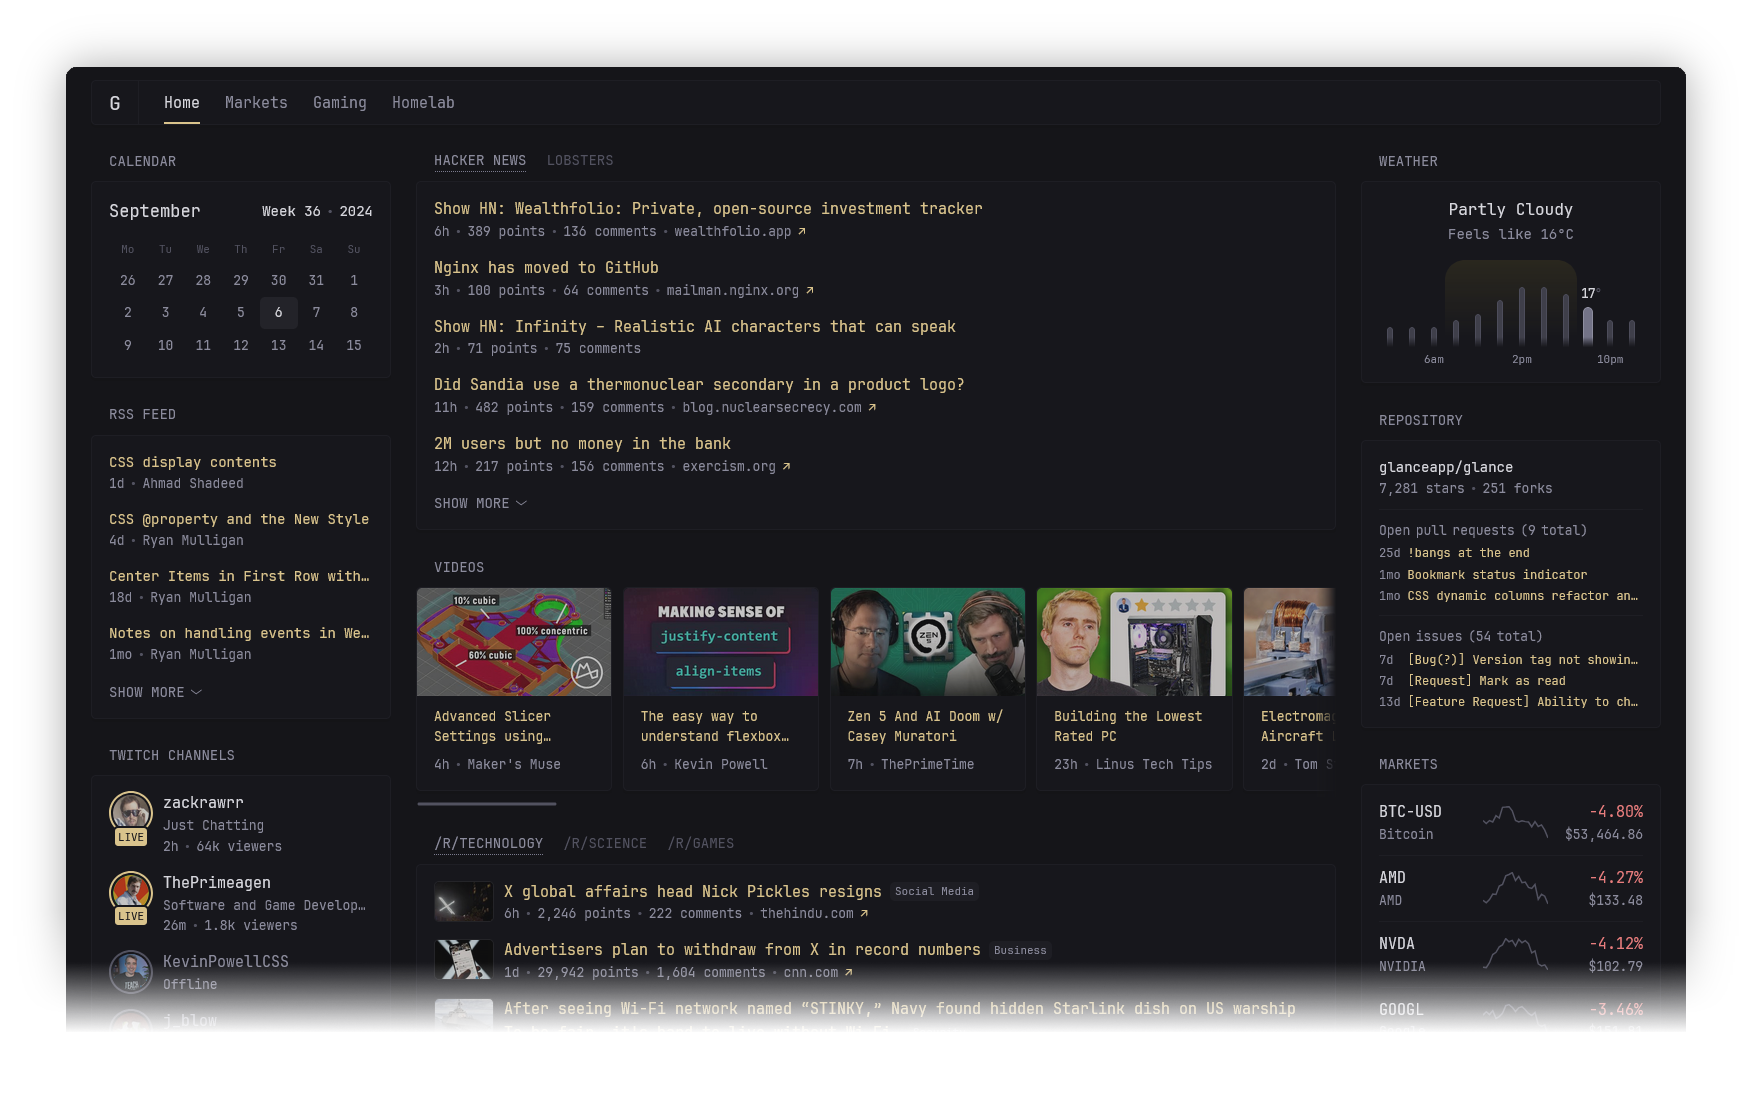
I've been looking for a solution that would gather all this digital noise into one neat page for a while now. And it seems I've found a project that does it without extra fanfare and overcomplication. Meet Dynacat.
What is this Dynacat beast
Essentially, it's a lightweight self-hosted dashboard. The project grew as a fork of another tool — Glance, but with a focus on dynamics. If Glance sometimes felt static, Dynacat is tailored for data to update "on the fly" and play nice with external services.
The main highlight here is simplicity. The entire backend is in Go, the frontend is plain JS without heavy frameworks. The result is a binary under 20 MB that doesn't eat up memory and runs on practically any "iron", be it an old Raspberry Pi or a home NAS.
What you can put on screen
The developer didn't reinvent the wheel and implemented support for the most in-demand stuff. Here's what I set up in the first ten minutes:
- News aggregators. RSS feeds, latest posts from Reddit and Hacker News. You can configure limits: for example, show only 5 fresh news items so you don't get buried in reading.
- Resource monitoring. Docker container status and overall server stats. It's very convenient to see that everything is "green" without opening the console.
- Dev activity. GitHub release list. No more refreshing repository pages to find out if a new software version came out.
- Media. Fresh videos from YouTube channels and Twitch streamer status.
- Finance and weather. Stock quotes, crypto, and forecast for your city.
Interestingly, the project supports custom widgets. If something is missing "out of the box", you can polish your own solution via Dynawidgets.
How it's configured
Forget about admin panels and mouse clicking. The entire dashboard description lives in YAML files. For some this is a downside, but for a developer — pure bliss. You can put the config in Git, version it, and quickly roll it out anywhere.
Here's an example of a typical page config:
  - name: Work
    columns:
      - size: small
        widgets:
          - type: calendar
            first-day-of-week: monday
          - type: weather
            location: Moscow, RU
            units: metric

      - size: full
        widgets:
          - type: hacker-news
          - type: releases
            repositories:
              - Panonim/dynacat
              - golang/go
The structure is intuitive: divide the page into columns, put widgets in the columns. You can create multiple tabs if there's too much information.
Design and mobile
The author clearly understood that we'd be opening this dashboard from our phone while drinking coffee. The interface is responsive and looks on a smartphone like a native app.
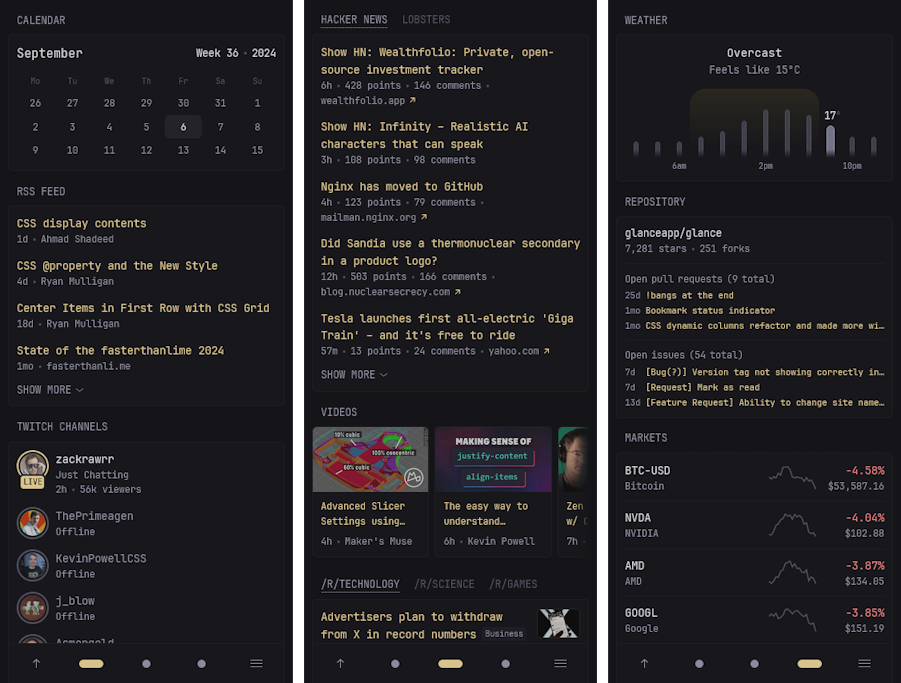
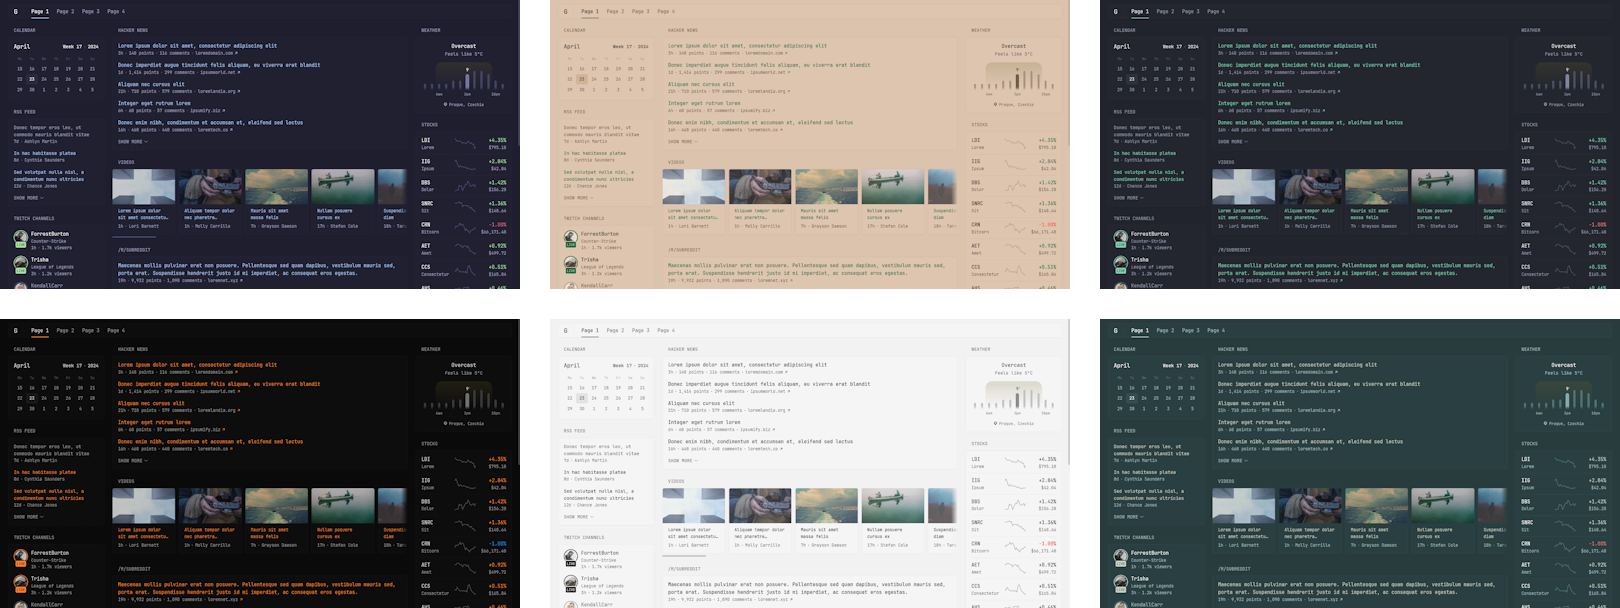
Plus there's theme support. If you don't like the default look, you can choose from ready-made presets or tweak the CSS yourself. No "eye-bleeding" colors, everything is pretty minimalist.
A couple of nuances when launching
During the setup process, I noticed a few things worth knowing in advance:
- DNS issues. If you have Pi-Hole or AdGuard Home running at home, they might block frequent widget requests to external APIs. The documentation suggests simply raising the limits in the blocker settings.
- Extension conflicts. A known bug: the Dark Reader browser extension can break the layout of some widgets (e.g., market charts). Better to add the dashboard domain to exceptions right away.
- Security. By default, Dynacat prohibits embedding in iframes from other domains. If you plan to stuff it inside another portal like Homepage, you'll need to tweak the server config.
Verdict: is it worth trying
If you already have a home server or just tired of chaos in your bookmarks, Dynacat is a great candidate for the role of "start page".
Who it'll definitely appeal to:
- HomeLab owners.
- Those who want to see the state of their projects and servers in one place.
- Minimalists who value interface speed.
The project is still fresh, but the core features work stably. Page load time is about a second, it consumes minimum resources — seems like this is exactly what's needed for comfortable monitoring without extra headaches.
Check out the Dynacat repository, the README has a link to documentation with a detailed description of all parameters. I think I'll go add a couple more RSS feeds to my feed.
相关项目